








Preface
Web Design Statistics: A website is often the first place people go to learn about a business, brand, or service. That is why good web design matters. It is not just about making a website look attractive; it is about making it simple, useful, and easy to explore. A well-designed website helps visitors find information quickly, works smoothly on phones and computers, and creates a strong first impression. From colors and fonts to images, layouts, and navigation, every element plays a role.
As more businesses move online, effective web design has become a key part of building trust and reaching customers. In this article, we explore web design, its importance, key elements, trends, and useful statistics.
Best Choice
- The global web design market is valued at USD 40+ billion, while the U.S. market is worth about USD 11 billion.
- The website-builder market is forecast to grow from USD 3.57 billion in 2026 to USD 7.67 billion by 2031, at a 16.58% CAGR.
- In-house designers represent 42% of U.S. respondents; agencies account for 21%, full-time freelancers 20%, and business owners 7%.
- Nearly 93% of web designers use AI tools, especially for media creation (58%) and page design (51%).
- Mobile accounted for 52.57% of global web traffic in July 2026.
- In May 2026, 49.1% of mobile and 58.0% of desktop sites passed Core Web Vitals.
- A basic website design project takes about 3 months on average, covering planning, content creation, design, development, and testing.
- A 1-second page-speed delay may reduce conversions by 7%.
- Mobile pages average 8.6 seconds to load, versus 2.5 seconds on desktop.
- Poor UX discourages 88% of visitors from returning.
- Clean, simple layouts are preferred by 84.6% of users.
Web Design Industry Size & Workforce
- According to Colorlib, the global web design market is valued at USD 40+ billion, while the U.S. market is worth about USD 11 billion.
- The US has approximately 200,000 web designers, with a median salary of USD 58,910.
- UX designers earn a higher median salary of around USD 95,000-USD 115,000.
- Freelancers account for 35% of the design workforce, with typical rates of USD 50-USD 100 per hour.
- More than 1.1 billion websites exist online, including about 200 million active websites.
- Small-business websites typically cost USD 5,000-USD 10,000, while custom enterprise websites can cost USD 50,000-USD 500,000+.
- Website builders power 20%+ of new websites, increasing competition for traditional design agencies.
- Websites are typically redesigned every 203 years, compared with 3-5 years a decade ago.
- Design agencies generate profit margins of 15%-25%, while 46% of small businesses still do not have a website.
Website Builders Market Outlook
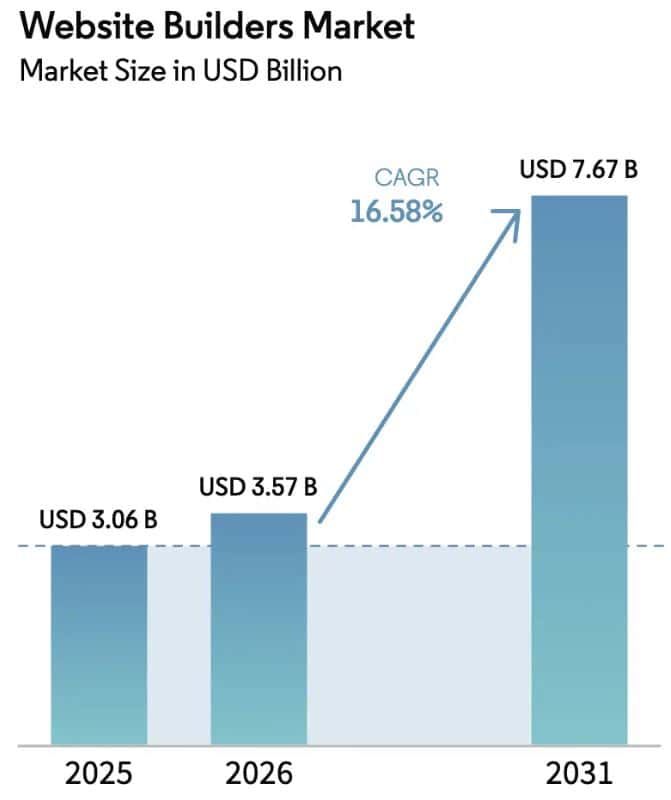
(Source: mordorintelligence.com)
- The global website builders market was valued at USD 3.06 billion in 2025 and is estimated to reach USD 3.57 billion in 2026.
- The market is projected to grow at a 16.58% CAGR between 2026 and 2031.
- By 2031, the market is expected to reach USD 7.67 billion.
Segmentation and Growth
- In 2025, PC website builders led the market with a 63.12% share. However, mobile website builders are expected to grow at a CAGR of 17.43% through 2031.
- Cloud-based website builder platforms accounted for 81.08% of total revenue.
- Business users represented 57.35% of market demand in 2025. Individual users are forecast to grow at a 19.06% CAGR through 2031.
- Plans priced below USD 15 per month captured 38.10% of demand. Plans priced between USD 15 and USD 50 per month are projected to expand at a 19.72% CAGR during 2026-2031.
- North America held a 38.25% revenue share, while Asia-Pacific is expected to record an 18.76% CAGR from 2026 to 2031.
Top 10 Biggest Web Design Trends in 2026
- AI personalization: Nearly 93% of web designers use AI tools, with 58% creating media and 51% designing pages, as per Webflow data.
- 3D visuals: Websites increasingly use 3D, WebGL, AR, and interactive product views.
- Tactile maximalism: Bold colors, textures, animation, and 3D elements create richer experiences.
- Unique design systems: Brands are developing distinctive visual styles rather than relying on generic AI-generated designs.
- Dynamic typography: Oversized, animated fonts make text a more powerful storytelling tool.
- Richer colors: Vibrant palettes, gradients, and multiple colors are replacing simple accent-color systems.
- Purposeful motion: Micro-interactions and guided scrolling help users navigate and understand content.
- TL;DR content: Websites now prioritize key information first, followed by optional deeper details.
- Accessibility-first UX: WCAG 2.1 AA is becoming more important, with April 24, 2026, deadlines for some U.S. government websites, according to ADA.gov.
- Mobile-first performance: About 90% of websites use responsive design, while 62% of top-ranking sites are mobile-optimized; slow images affect 39% of users, and 1-second delays can reduce conversions by 7%.
Web Design Time Statistics
- Forbes Advisorforbes further stated that a basic website design project takes about 3 months on average, covering planning, content creation, design, development, and testing.
- Among web designers, 80.7% complete a website within 1 month; 27% take 2 months, while 24.3% require around 1.5 months, according to Email Vendor Selection
- Evolve Media reported that small websites with roughly 10 pages typically require 3-5 weeks, while medium projects take 6-8 weeks.
- Meanwhile, complex 50+ page ecommerce projects need 10-16 weeks.
- Most businesses should redesign their websites every 2-3 years to remain competitive.
Performance Statistics By Load Time Benchmarks
- As per a report published by Hostinger, the recommended website load time is under 2 seconds, while the average page load time is 2.5 seconds on desktop and 8.6 seconds on mobile.
- Mobile pages load about 70.9% longer than desktop pages. WordPress sites average 2.5 seconds on desktop and 13.25 seconds on mobile.
- Pages ranking in Google’s top 10 results average 1.65 seconds to load.
- The average webpage weighs 2.3 MB, while 40+ million websites use CDNs.
- Desktop users view an average of 3.4 pages per session.
- About 47% of users expect websites to load within 2 seconds, while nearly 75% of mobile users find pages too slow.
By Bounce Rate Impact
- A 1-3-second delay can increase bounce probability by 32%, while a 10-second delay can raise it by 123% compared with a 1-second load, according to Tooltester
- A 2-second delay can increase bounce rates by 103%.
- Average bounce rates are 56.8% on mobile, 51.6% on tablets, and 50% on desktops.
- About 88.5% of users cite slow loading as a major reason for abandoning a website, and 53% of mobile visitors leave pages that take more than 3 seconds to load.
By Conversion and Revenue Effects
- Shopify reported that each additional second of load time can reduce conversions by about 7%, page views by 11%, and customer satisfaction by 16%.
- On mobile, a 1-second delay can reduce conversions by 20%.
- Deloitte found that improving speed by 0.1 seconds increased retail conversions by 8% and customer spending by 10%.
- E-commerce conversion rates average 3.05% below 2 seconds but fall to 0.67% at 4 seconds.
- A 2-second delay can push cart abandonment as high as 87%.
- Slow websites cost online retailers an estimated USD 2.6 billion annually.
- A business generating USD 100,000 per day could lose about USD 2.5 million annually from a 1-second delay.
- Nearly 70% of consumers say page speed affects purchasing decisions, while 79% of dissatisfied shoppers are less likely to return.
By Core Web Vitals
- In May 2026, 58.0% of desktop and 49.1% of mobile web origins passed all 3 Core Web Vitals thresholds.
- Mobile pass rates increased from 28.6% in 2022 to 49.1% in 2026.
- Some studies report lower rates of about 42% for mobile and 63% for desktop, depending on methodology.
- A website passes the Core Web Vitals assessment when LCP is 2.5 seconds or less, INP is 200 milliseconds or less, and CLS is 0.1 or lower for at least 75% of visits.
- About 67% of sites achieve an LCP below 2.5 seconds.
Key UX/UI Design Statistics and Insights
- Design influences 94% of first impressions, and users can form an opinion in just 0.05 seconds, as per BCS/HCI research
- Poor UX can prevent 88% of users from returning, showing why usability is critical for customer retention.
- According to uxcrush.com, UX investment can deliver a return of USD 100 for every USD 1 invested, according to Forrester.
- About 75% of users judge a website’s credibility based on its design, while 38% focus first on layout and navigation.
- Good UX can increase conversions by 200%-400%, and 73% of companies plan to increase their UX budgets.
- Poor usability contributes to failure for 70% of online businesses, highlighting the importance of user-friendly design.
- Clear calls to action can improve conversions by 120%+, while users spend 5.94 seconds viewing a website’s main image.
- Around 85% of adults expect mobile websites to perform as well as or better than desktop versions.
- Adding white space around text can improve comprehension by 20%.
- Only 55% of companies conduct UX testing, but those that do report 2x higher customer satisfaction.
Mobile and Responsive Web Design Statistics
- According to GS.statcounter, mobile devices accounted for 52.57% of global web traffic in July 2026, making mobile-first design essential for businesses.
- Google uses mobile-first indexing for 100% of new websites, while more than 85% of websites use responsive design.
- About 85%+ of websites use responsive design.
- Mobile conversion rates are around 2.2%, compared with 4.4% on desktop, while mobile bounce rates reach 51%, compared with 41% on desktop.
- The average mobile page weighs about 2.2 MB, based on HTTP Archive data.
- Only 40% of websites optimize their interfaces for comfortable thumb use.
- About 74% of users are more likely to return to mobile-friendly websites, while mobile ecommerce accounts for 73% of global ecommerce sales.
- Mobile sessions average 2.5 minutes, compared with 6 minutes on desktop.
- Progressive Web Apps can increase engagement by 68%, while 61% of users may not return after experiencing mobile access problems.
Primary Roles in Web Design
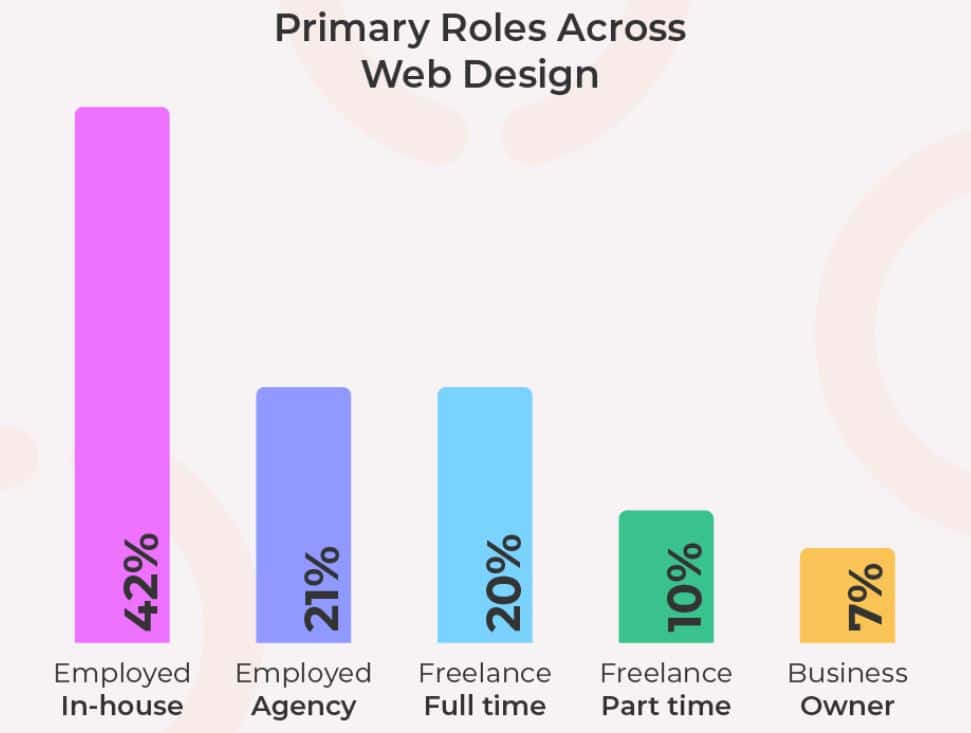
(Source: 20i.com)
- In-house employees make up the largest group of web design professionals, accounting for 42%.
- Agency-based employees represent 21%, while full-time freelancers account for a similar 20% share.
- Part-time freelancers comprise 10%, and business owners represent the smallest group at 7%.
Web Design Statistics by Organization Type
- 20i 2026 Web Designer Survey further mentioned that about 42% of U.S. web designers work in-house, while 21% work for agencies.
- 20% work as full-time freelancers, 10% as part-time freelancers, and 7% are business owners.
- 21% work at companies with 51-250 employees, 17% at firms with 251-1,000 employees, and 9% at organizations with 1,000+ employees.
- The findings are based on a survey of 500 U.S. professionals.
Modern Web Design Statistics
- 84.6% of users prefer a clean and simple website design over a crowded layout.
- 38% of visitors assess the layout and navigation of a website on their first visit.
- A video background can improve conversion rates by 138% compared to static backgrounds.
- 36% of website visitors click on the logo to return to the homepage.
- 57% of successful websites use the color blue in their design (e.g., Facebook, WordPress, Twitter).
- 40% of users focus on images, 21% on videos, while the rest notice the color scheme and other visual elements.
AI Adoption in Web Design, 2026
- Figma surveyed 906 digital designers across North America, APAC, Europe, LATAM, and the Middle East, providing a broad view of design trends.
- AI is now widely used in design. 91% of designers said it improves their work, while 89% said it helps them work faster.
- Additionally, 80% said AI improves collaboration, and AI users were 25% more likely to report higher job satisfaction.
- Workplace conditions also matter. 87% said creative freedom improves performance, 91% highlighted clear goals, and 90% considered collaboration essential for good work.
- According to Hostinger, nearly 93% of web designers use AI tools.
- The most common uses include image and media generation (58%), page design (51%), testing ideas (49%), design improvements (43%), performance tracking (40%), and UX auditing (20%).
Wrap-Up
Good web design helps a website look attractive and work smoothly. A simple layout, easy navigation, fast loading, and mobile-friendly design can improve the user experience. Clear content and easy-to-use features also help visitors find what they need quickly. As technology evolves, websites must continually improve to meet user needs. In short, successful web design is not only about appearance. It is about creating a website that is simple, useful, fast, and easy for everyone to use.
FAQ
Key elements include layout, navigation, typography, colors, images, spacing, content, responsiveness, accessibility, and page speed.
Website design typically takes a few days to several weeks, depending on complexity.
A user-friendly website is easy to navigate, fast, mobile-friendly, accessible, and provides clear, useful information.

Sources


