
Introduction
Pet Ownership Statistics: Pets have become an important part of everyday life, with millions of households around the world owning at least one animal. From dogs and cats to birds, fish, and small pets, ownership continues to rise as people seek companionship, emotional support, and a better quality of life. Growing pet adoption, higher spending on pet care, and increased demand for premium products are transforming the industry. Younger generations are leading many of these trends, while pet owners are also investing more in healthcare, insurance, grooming, and nutrition.
This article highlights the latest pet ownership statistics, including adoption patterns, spending habits, regional trends, and consumer preferences that shape the global pet care market.
Editor’s Choice
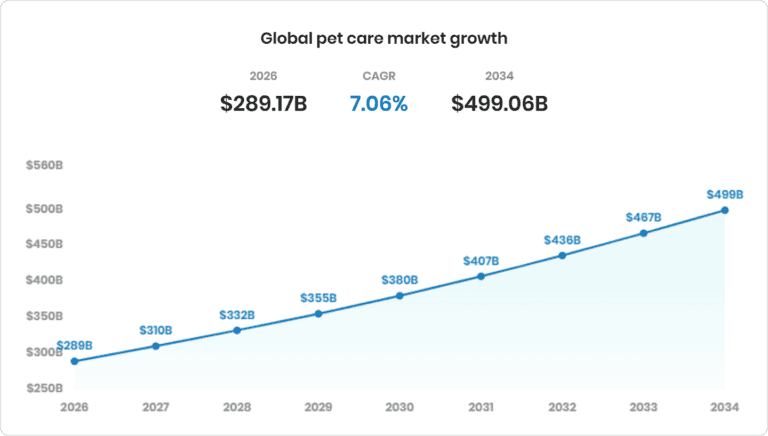
- The global pet care market is projected to grow from USD 289.17 billion in 2026 to USD 499.06 billion by 2034, at a CAGR of 7.06% between 2026 and 2034.
- As of 2026, pet-owning households have grown to 95 million, accounting for 71.6% of U.S. households.
- Gen Z reports the highest ownership rates across most pet categories, with 86% owning dogs and 81% owning cats.
- Nearly 60% of U.S. pet owners are women, many of whom are wealthy.
- In the first quarter of 2026, Millennials led pet ownership with a 33% share globally.
- Moreover, 38% of dog and 40% of cat owners adopted from an animal shelter or rescue.
- Dogs remain the most widely owned pet in America, present in 42.6% of U.S. households, while cats are kept in 32.6% of homes.
- Beyond dogs and cats, fish are the most commonly kept alternative pet at 2.6% of households, followed by reptiles (1.8%) and birds (1.6%).
- The average annual cost of owning a dog is USD 1,533, including veterinary care (USD 679.50), pet insurance (USD 601.01), and seven-day boarding (USD 253).
- Wyoming leads the nation with 71.8% of households owning a pet, followed closely by West Virginia at 70.7%.
- In recent years, 63.3% of owners say they spend most of their vet money on routine pet care.
- 7% of respondents were very likely and 17% somewhat likely to buy pet insurance within the next three months.
General Pet Ownership Statistics
- The average yearly cost for essential dog expenses is around USD 1,533 for most pet owners.
- Dogs are the most popular pets in the U.S., with 65.1 million households owning one.
- Besides, cats are second with 46.5 million households, followed by freshwater fish with 11.1 million.
- Pet Ownership Statistics also show that around 42% of dog and 43% of cat owners got their pets from a store.
- Whereas 38% of dog and 40% of cat owners adopted from an animal shelter or rescue.
- A report published by Forbes indicates that in 2024, households earning USD 100,000 or more are most likely to own pets: 63% own dogs, and 40% own cats.
- Similarly, homeowners are more likely to have pets than renters, with 58% owning dogs and 36% owning cats compared to renters.
- As of 2024, people living in rural areas in the U.S. are more likely to own pets, with 71% having a pet.
- Compared to suburbs and cities, people in rural areas are more likely to have multiple pets, with 47% owning more than one.
- Around 23% of dog and 7% of cat owners got their pets from breeders.
Interesting Facts of Pet Ownership
- Around 6% of pets in the United States, about 2 million, travel by plane with their owners each year.
- To date, there are about 30 to 40 million homeless cats in the United States.
- Nearly 60% of U.S. pet owners are women, many of whom are wealthy.
- Besides, 77% of women in pet-owning households earning over USD 220,000 are aged 50 or older.
- According to the ASPCA, about 6.3 million pets enter shelters in the U.S. each year, including 3.1 million dogs and 3.2 million cats.
- People living in mobile homes have the highest pet ownership rate at 73.8%.
- Pet Industry data indicates that 56% of adult dogs are classified as overweight.
World Pet Ownership Statistics
- The global pet care market is projected to grow from USD 289.17 billion in 2026 to USD 499.06 billion by 2034, at a CAGR of 7.06% between 2026 and 2034, according to Nova Vet Family.
- In Europe, around 49% of households own at least one pet, contributing to a total pet population of approximately 299 million animals.
(Source: novavetfamily.com)
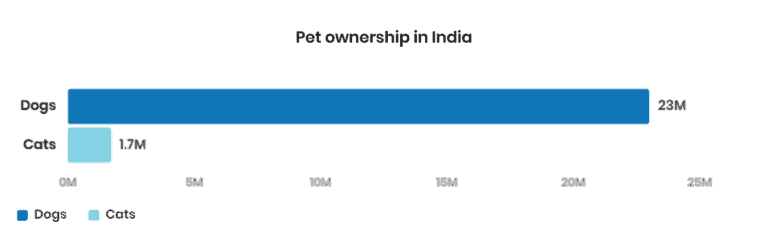
- India has nearly 23 million dogs and 1.7 million cats in households.
- Around 90% of families in the U.S. consider their dogs important members of the family.
- Similarly, there are 249.6 million pet birds in homes.
- Europe has approximately 139 million pet-owning households.
- Russia secured the highest percentage of cat owners in the world, with 59% of people owning a cat.
- In the last 25 years, the pet industry has grown by 450%.
- By the end of 2027, this industry is expected to reach USD 358.62 billion.
- Moreover, the pet grooming industry reached USD 14.46 billion in 2025.
United States Pet Ownership Statistics
(Source: worldanimalfoundation.org)
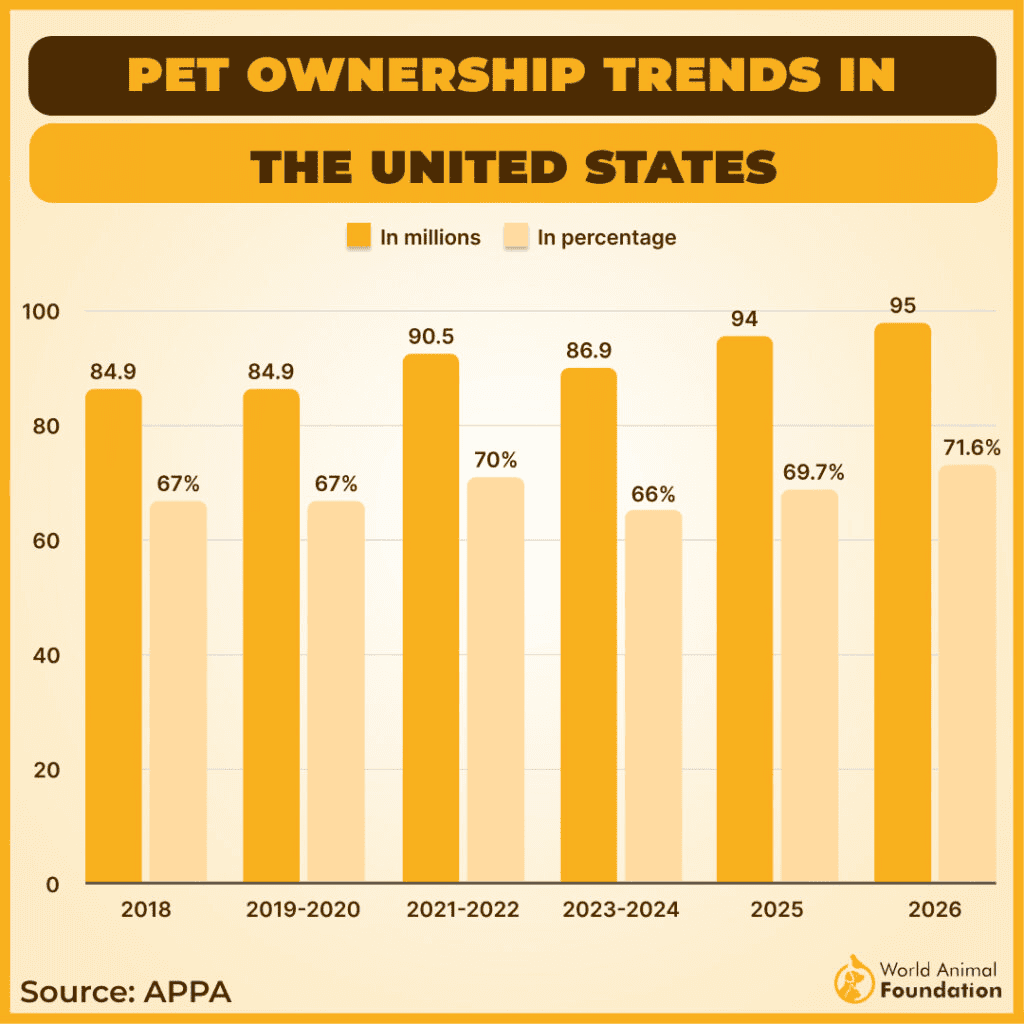
- In 2025, approximately 94 million U.S. households owned at least one pet, representing 69.7% of all American households.
- As of 2026, pet-owning households will reach 95 million, accounting for 71.6% of U.S. households.
By Demographics
- According to the latest data from the American Pet Products Association (APPA), in the first quarter of 2026, Millennials led pet ownership with a 33% share.
- Meanwhile, Generation X accounts for 25% of pet owners, followed by Baby Boomers (24%) and Generation Z (20%).
- Meanwhile, 63% of households earning over USD 100,000 own dogs, and 40% own cats.
By Types of Dogs and Cats
- According to a report published by American Veterinary Association, dogs remain the most widely owned pet in America, present in 42.6% of U.S. households, while cats are kept in 32.6% of homes.
| Metrics | Dogs | Cats |
| Total households owning | 56.3 million | 43.1 million |
| Average number per pet-owning household | 1.6 | 1.8 |
| Total population in the U.S. | 87.3 million | 76.3 million |
| Avg. annual veterinary spending per household | USD 598 | USD 529 |
By Other Pet Species
- Beyond dogs and cats, fish are the most commonly kept alternative pet at 2.6% of households, followed by reptiles (1.8%) and birds (1.6%).
| Species | Households Owning (Millions) | U.S. Households Share |
| Fish | 3.4 | 2.6% |
| Reptiles | 2.4 | 1.8% |
| Birds | 2.1 | 1.6% |
| Small Mammals (gerbils, hamsters, etc.) | 1.1 | 0.8% |
| Rabbits | 0.8 | 0.6% |
| Poultry | 0.9 | 0.7% |
| Horses | 0.5 | 0.4% |
Most Popular Pets in the U.S.
(Reference: forbes.com)
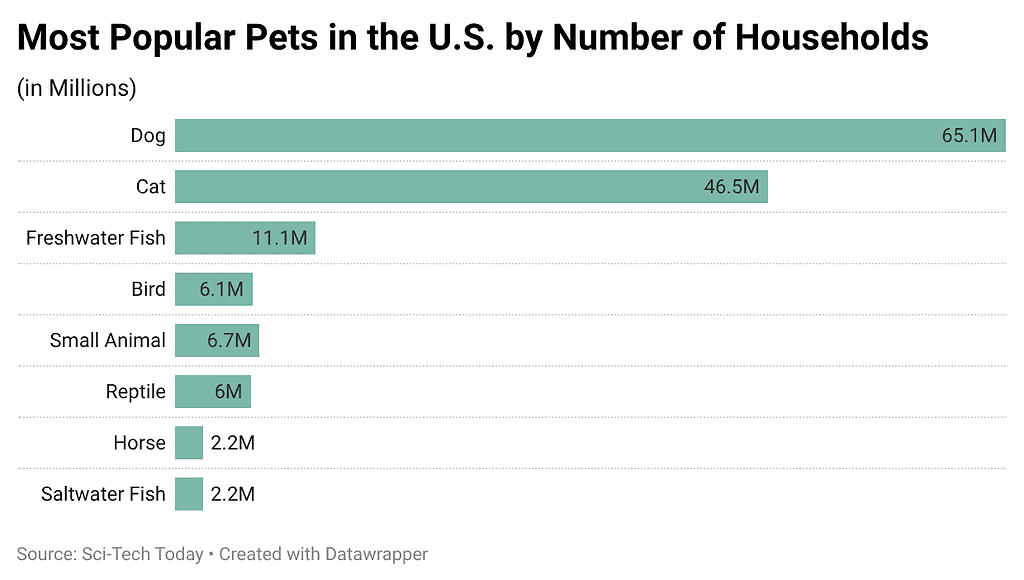
- Dogs remain the most common pets in the U.S., living in 65.1 million households, followed by cats in 46.5 million households.
- Freshwater fish are kept in 11.1 million households, while small animals and birds are owned by 6.7 million and 6.1 million households, respectively.
U.S. State-Level Pet Ownership Statistics
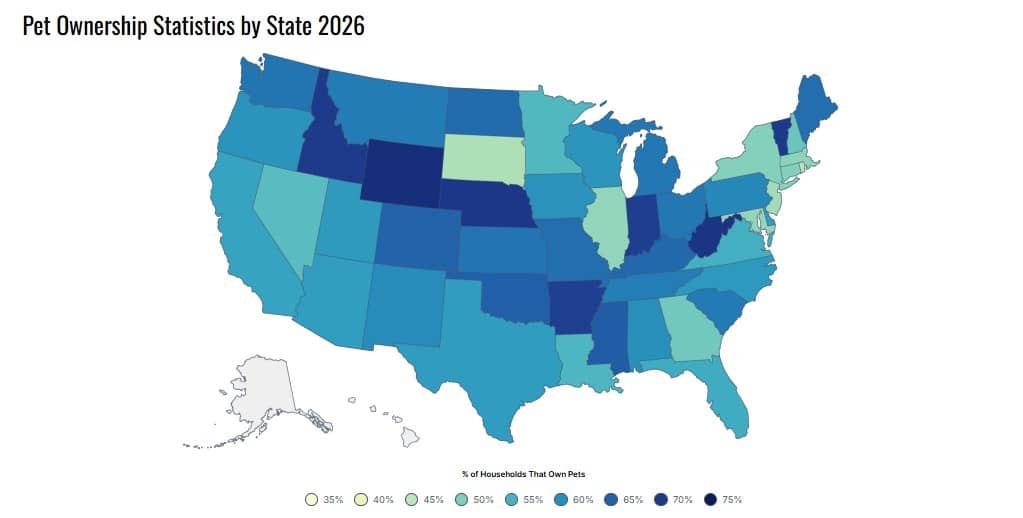
(Source: worldpopulationreview.com)
- Wyoming leads the nation with 71.8% of households owning a pet, followed closely by West Virginia at 70.7%.
- Idaho records the highest dog ownership rate at 58.3%, while Montana (51.9%) and West Virginia (51.6%) rank second and third.
- Vermont tops cat ownership at 44.6% of households, ahead of Maine (43.6%) and Oklahoma (38.4%).
- New Hampshire is the most cat-dense state, with 163 cats per 100 dogs.
- The District of Columbia has the lowest pet ownership at 38.2%, and Rhode Island has the lowest cat ownership at 16.7%.
- Los Angeles has the most pets at approximately 2.6 million cats and dogs, followed by New York City, with around 1.1 million.
Pet Care Market Statistics
(Source: novavetfamily.com)
- The global pet care market is expected to grow from USD 289.17 billion in 2026 to USD 499.06 billion by 2034, registering a CAGR of 7.06%.
- Global spending on pet care reached USD 273.42 billion in 2025
- Fortune Business Insights further stated that pet food products, including dry food, wet food, and treats, led the market with a 52.60% share in 2025 and are projected to expand at a 7.00% CAGR through 2034.
- Dogs remained the largest pet category, accounting for 48.09% of the market in 2025, with an expected CAGR of 7.57% from 2026 to 2034.
- Offline sales channels dominated with a 73.00% market share in 2025, while the online segment is forecast to grow at a CAGR of 3.71%.
- The rest of the world contributed USD 103.93 billion in regional pet care spending.
By Regional Outlook
(Source: fortunebusinessinsights.com)
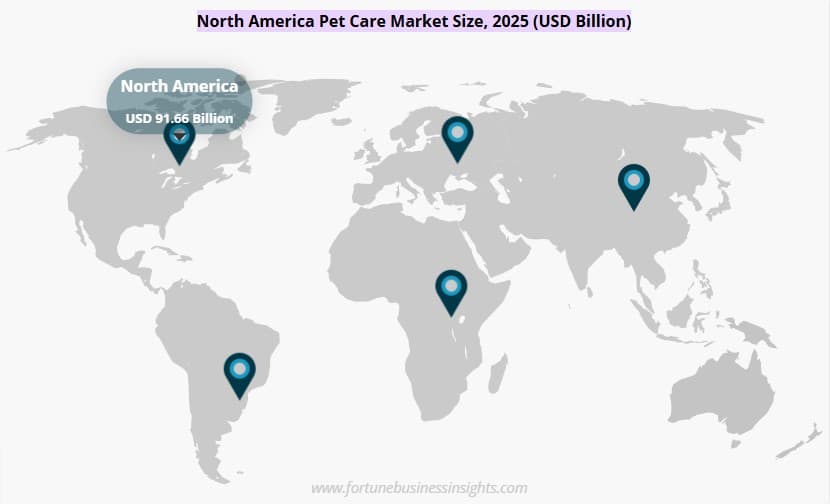
- North America generated USD 91.66 billion in 2025, representing 33.52% of global revenue, and is projected to reach USD 96.67 billion in 2026.
- The U.S. accounted for USD 75.55 billion, representing 27.63% of global sales.
- Europe generated USD 77.83 billion in 2025, holding a 28.47% market share, and is expected to reach USD 82.94 billion in 2026.
- The U.K. contributed USD 21.91 billion (7.32%), while Germany accounted for USD 20.01 billion (8.01%).
- Asia Pacific reached USD 56.51 billion in 2025, representing 20.67% of the global market, and is forecast to grow at a CAGR of 7.24% from 2026 to 2034.
- China generated USD 22.15 billion (8.10%), India USD 14.80 billion (5.41%), and Japan USD 10.74 billion (3.93%).
- South America recorded USD 30.41 billion in 2025.
- The Middle East & Africa market reached USD 17.00 billion in 2025, accounting for 6.22% of global revenue, and is projected to grow to USD 17.70 billion in 2026.
- South Africa contributed USD 4.98 billion, followed by the UAE at USD 2.20 billion, representing 0.80% of global market revenue.
The United States Pet Industry Expenditure Statistics
(Source: worldanimalfoundation.org)
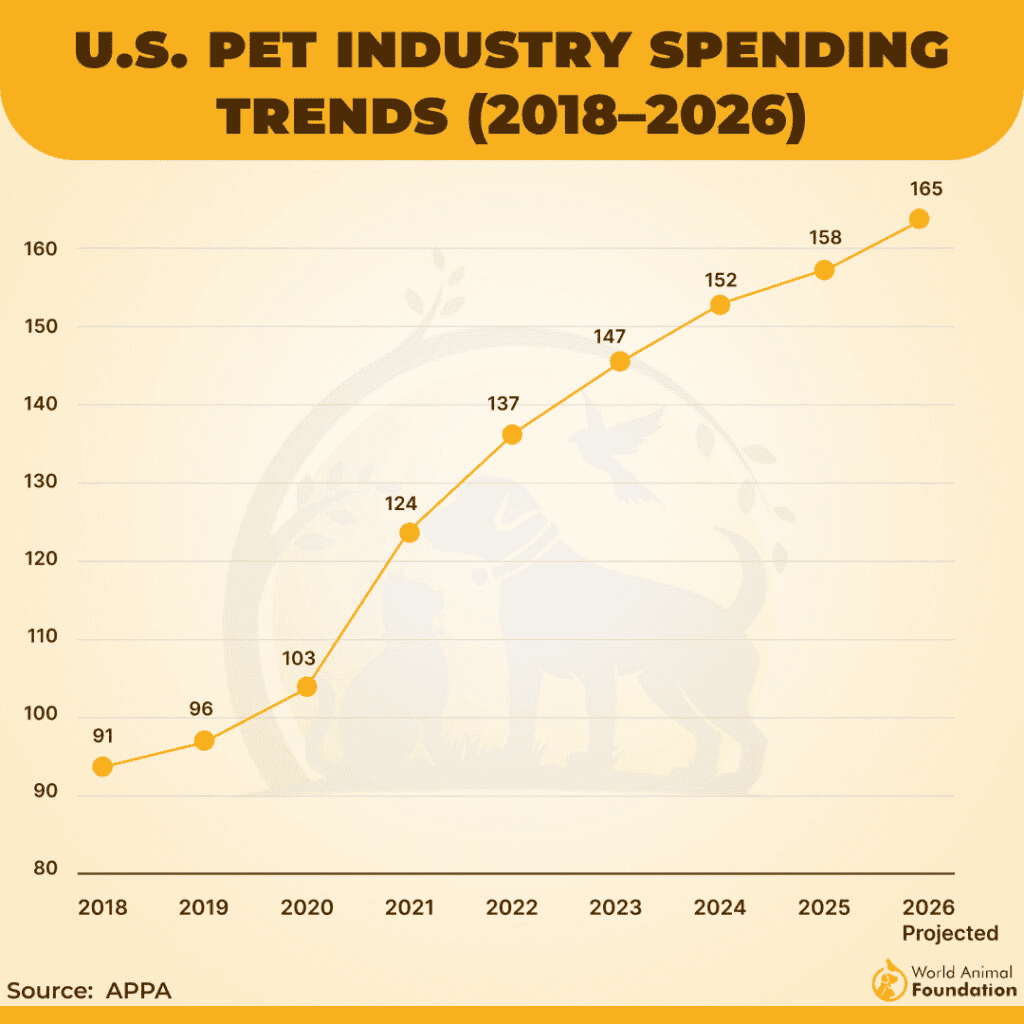
- U.S. pet owners spent USD 158 billion on their pets in 2025, with total spending projected to rise to USD 165 billion in 2026.
- Pet food and treats remain the largest category, with projected 2026 sales of USD 69.7 billion, up from USD 68.3 billion in 2025.
- Pet supplies, live animals, and OTC medicine are projected to reach USD 35.6 billion by the end of 2026.
- Veterinary care and products are projected to reach USD 42.4 billion, reflecting growing demand for pet health services.
- Other pet services (grooming, boarding, training) are anticipated to add USD 14.9 billion to overall industry revenue.
- Looking further ahead, the global pet toy market alone is forecast to surpass USD 8.6 billion by 2035.
Pet Ownership by Generation and Pet Type
| Generation | Dog | Cat | Hamster / Guinea Pig | Bird | Rabbit |
| Gen Z | 86% | 81% | 30% | 22% | 28% |
| Millennials | 66% | 59% | 15% | 20% | 19% |
| Gen X | 69% | 54% | 5% | 7% | 8% |
| Baby Boomers | 50% | 42% | 6% | 10% | 6% |
| Silent Generation | 77% | 58% | 10% | 18% | 10% |
Cost of Pet Ownership Insights
- According to Forbes, the average annual cost of owning a dog is USD 1,533, including veterinary care (USD 679.50), pet insurance (USD 601.01), and seven-day boarding (USD 253).
- Pet owners using doggy daycare twice a week spend an additional USD 2,980 annually on average.
- Unexpected veterinary expenses remain a challenge, with 42% of pet owners unable to cover a surprise vet bill of USD 999 or less without incurring debt.
- Average pet insurance costs are USD 44 per month for dogs and USD 30 per month for cats.
- Dog owners spend the most on veterinary care (USD 367), food (USD 339), and grooming (USD 99) each year.
- Cat owners primarily spend on food (USD 310), veterinary care (USD 253), and toys (USD 50) annually.
- Gen Z pet owners are the most likely to purchase birthday cakes (34%), birthday gifts (39%), and clothing or costumes (32%) for their pets.
- They also lead spending on behavioral training (41%), specialized pet food (44%), doggy daycare (35%), and dog walking services (31%).
The Top Best Cities For Pet Owners Statistics
| City | Overall Score | Dog Vet Cost Score | Cat Vet Cost Score | Vet Access Score | Pet-Friendly Spaces Score |
| Kansas City (Missouri) | 100 | 98.75 | 98.75 | 75.63 | 64.49 |
| Nashville (Tennessee) | 98.91 | 96.24 | 96.24 | 61.88 | 84.04 |
| Albuquerque ((New Mexico) | 98.53 | 91.22 | 91.22 | 61.25 | 95.22 |
| Raleigh (North Carolina) | 97.09 | 79.94 | 79.94 | 91.88 | 79.7 |
| Wichita (Kansas) | 96.04 | 100 | 100 | 72.5 | 49.91 |
| Louisville (Kentucky) | 95.52 | 96.24 | 96.24 | 80 | 47.96 |
| Tucson (Arizona) | 94.51 | 91.22 | 91.22 | 63.75 | 77.25 |
| Greensboro (North Carolina) | 94.19 | 91.22 | 91.22 | 78.13 | 58.01 |
| Cincinnati (Ohio) | 92.45 | 91.22 | 91.22 | 71.88 | 59.46 |
| Tulsa (Oklahoma) | 91.91 | 91.22 | 91.22 | 77.50 | 51.16 |
The Top 10 Expensive Cities To Own A Dog
| Cities | Average Household Income (USD) | (Annual Cost) and (Share of Household) of vet care insurance & Boarding | (Annual Cost) and (Share of Household) of Daycare |
| Huntsville (Alabama) | 76,963 | USD 1,302 & 1.69% | USD 2,688 & 3.49% |
| Kansas City (Missouri) | 73,900 | USD 1,329 & 1.80% | USD 2,688 & 3.64% |
| Omaha (Nebraska) | 73,720 | USD 1,261 & 1.71% | USD 2,784 & 3.78% |
| Cincinnati (Ohio) | 70,818 | USD 1,341 & 1.89% | USD 2,688 & 3.80% |
| Jacksonville (Florida) | 68,394 | USD 1,341 & 1.96% | USD 2,880 & 4.21% |
| San Antonio (Texas) | 66,775 | USD 1,327 & 1.99% | USD 2,592 & 3.88% |
| Louisville (Kentucky) | 64,029 | USD 1,362 & 2.13% | USD 2,784 & 4.35% |
| Fort Wayne (Indiana) | 62,155 | USD 1,345 (2.16%) | USD 2,847 (4.58%) |
| Oklahoma City (Oklahoma) | 61,815 | USD 1,292 (2.09%) | USD 2,688 (4.35%) |
| El Paso (Texas) | 51,002 | USD 1,323 (2.59%) | USD 2,496 (4.89%) |
Pet Ownership and Insurance Statistics
- Pet Ownership Statistics further states that around 26.7% of people said veterinary care is their biggest pet-related expense.
- Almost 78.8% of pet owners believe pet insurance is worth the cost for them and their pets.
- Meanwhile, nearly 53.7% of people with pet insurance have coverage for their dog in their policy.
- Similarly, 36.7% of them have taken on debt to cover their pet’s medical expenses.
- In recent years, 63.3% of owners say they spend most of their vet money on routine pet care.
Pet Insurance Purchase Intent and Financial Concerns
- According to Forbes, 7% of respondents were very likely and 17% somewhat likely to buy pet insurance within the next three months, while 28% remained neutral.
- In contrast, 12% were somewhat unlikely, and 35% were very unlikely to purchase a new policy, while 0% reported already having pet insurance.
- Rising costs continue to affect pet owners, with 63% stating they would struggle to pay an unexpected veterinary bill.
- A vet expense of USD 499 or less would push 28% of pet owners into debt, while a bill of USD 999 or less would affect 42%.
- Despite these concerns, 79% of pet owners do not currently have pet insurance.
- Inflation has reduced purchase interest for many consumers, with 30% saying they are less likely to buy pet insurance, compared with 22% who reported being more likely to purchase coverage.
Conclusion
Pet ownership is growing worldwide as more people recognize the emotional and health benefits of having pets. In recent years, the pet industry has grown significantly, reflecting a strong bond between pets and their owners.
But owning a pet also means taking on responsibilities, like spending money on food, healthcare, grooming, and more.
