Introduction
Infographic Statistics: Infographics have emerged as a powerful tool in data communication, significantly enhancing content engagement and information retention. Approximately 60% of businesses have integrated infographics into their content strategies, recognizing their effectiveness in conveying complex data succinctly.
Content incorporating images and graphics, such as infographics, can achieve up to 650% higher engagement compared to text-only content. Furthermore, infographics are 30 times more likely to be read than purely textual articles, underscoring their appeal to audiences. The human brain processes visual information more efficiently, with 90% of information transmitted to the brain being visual.
Additionally, 65% of individuals are visual learners, highlighting the importance of visual aids in learning and information dissemination. When information is paired with relevant images, people retain 65% of the information three days later, compared to only 10% when it is presented without visuals.
These statistics demonstrate the critical role of infographics in enhancing communication, improving comprehension, and increasing audience engagement across various platforms.
Editor’s Choice
- 65% of brands integrate infographics into their content marketing strategy, recognizing their effectiveness in conveying information.
- Infographics are 30 times more likely to be read than purely textual articles.
- When content is paired with relevant images, people retain 65% of the information.
- Image results appear in 27.9% of Google searches, highlighting the importance of visual content in search visibility.
- Posts with images have a 650% higher engagement rate compared to text-only posts.
- Infographics can increase website traffic by up to 12%.
- Tweets that include a visual are 150% more likely to be shared, underscoring the value of infographics in social media strategies.
- 33% of marketers choose infographics when incorporating visual elements into their marketing strategy.
- 69% of creatives use infographics twice a week.
- 55% of marketers consider social media infographics the most important type of visual content.
- Infographics improve attention spans and learning by 82%.
- 61% of business leaders expect non-design employees to have design skills.
- 63% of businesses provide training on visual communication tools.
- Original visuals drive engagement by 40%.
- 42% of U.S. consumers rely on recommendations that use infographics before making purchases.
- HubSpot’s 2022 report established that 33% of marketers regard infographics and illustrations as their top preference for visual content, followed by stock photos (30%), charts (15%), videos (13%), and lead-generation documents (5%).
- 65% of marketers are using infographics in their content strategies.
- Presentations that incorporate visual aids like infographics are 43% more persuasive, highlighting their impact on communication.
- Canva has surpassed 1 billion presentation designs.
- There has been a 105% growth in the number of LinkedIn profiles listing Canva as a skill over just one year.
- 53% of business leaders describe content as lacking aesthetic appeal.
- 56% of business leaders say content is inconsistent.
- 64% cite insufficient tools to create impactful content.
- Data visualization charts were the most frequently used visual content in 2023, utilized by 52.22% of marketers.
- 21.9% of marketers reported that over 75% of their content in 2023 consisted of visuals.
- Artificial Intelligence (AI) emerged as a significant tool for content creation, with 61.54% of marketers incorporating AI into their strategies in 2023.
- Many marketers allocate 20-50% of their budget to visual content, with an additional 9.5% planning to increase investment in 2024.
- Short-form videos continue to be a key trend, with 90% of advertisers leveraging them for business continuity.
- 30% of marketers create visual content to add brand value.
- 42% of marketers are using relatable and trend-based content for the first time.
- 49% of marketers are increasing investment in visual content.
- 43% of marketers report no change in their visual content strategy.
Some Important Infographics Statistics
- Infographic statistics reveal that more than 60% of organisations claim to have made use of infographics. This shows the extent to which most people have adopted it.
- Content that has images or graphics can get up to 650% more engagement percentages, which proves to be really effective through visuals.
- Infographics are 30 times more likely to be read than written articles, making them the go-to method of presenting information effectively. This means that presentations with infographics are up to 43% more persuasive as opposed to those without visual input.
- An article that contains an infographic would see an 80% increase in readership.
- The second most valued visual asset – infographics – stands at 36.6% of audience value.
- Because of this, they also provide great differences in terms of being successful online. Such websites that use infographics generate 12% more traffic, and 45% of online users are more inclined to click a link if it has an infographic in it.
- Blog posts and articles using infographics create up to 178% of extra external inbound links. It motivates them to have a better reach and credibility.
- SEO expert Matthew Woodward puts it aptly: The numbers don’t lie: infographics really are a game changer for business.
- Over 60% are already using them to score up to 650% more engagement – clearly, visuals are a must-have for cutting through the noise.
- Infographics are 30 times more likely to be read than text, making them a really effective tool for delivering complex information simply and quickly. After all, firms that do not tap this visual revolution are missing huge opportunities.
Infographics Type of Sections
 (Reference: enterpriseappstoday.com)
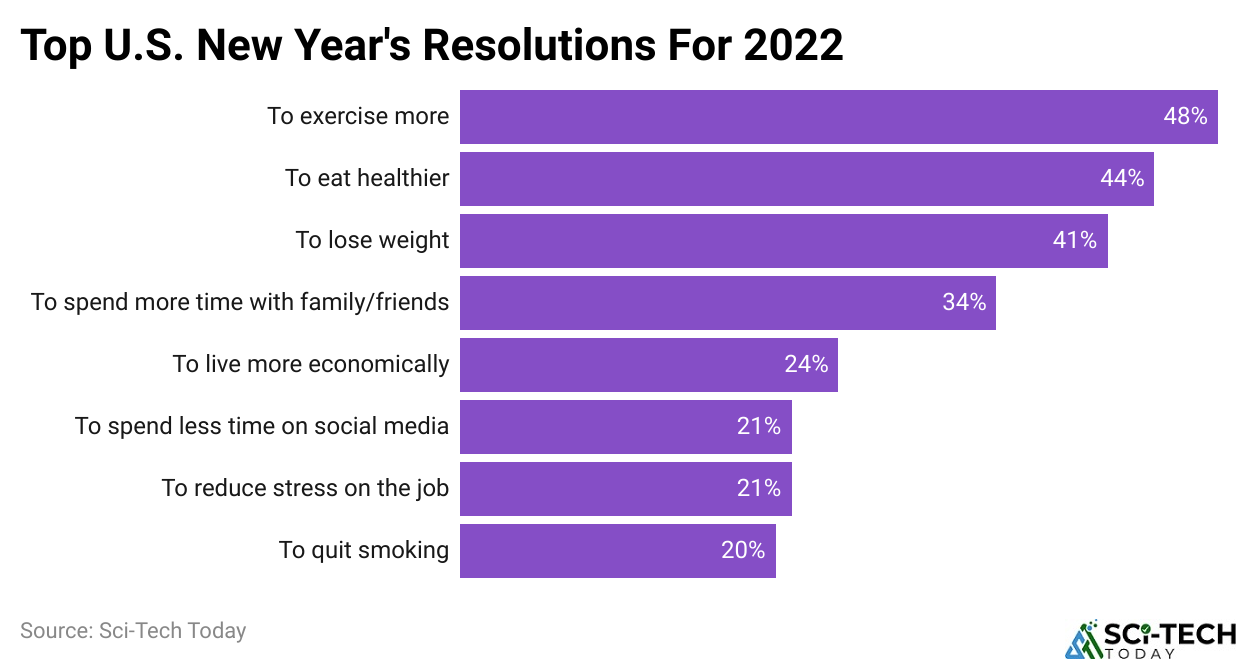
- This particular data representation focuses on New Year’s resolution trends in the adult population within the U.S.
- By early 2022, from studies derived, it has been discovered that 39 out of every 100 American adults resolved for the year 2022.
- Out of the resolution makers, 48 went further, intending to have increased exercise activity, while only 20 intended to quit smoking.
- According to infographic statistics, one out of five listeners intends to reduce his or her use of social media. Of those 40, the majority had pledged to lose weight and eat healthier.
Type Of Visuals Used
 (Reference: bloggingwizard.com)
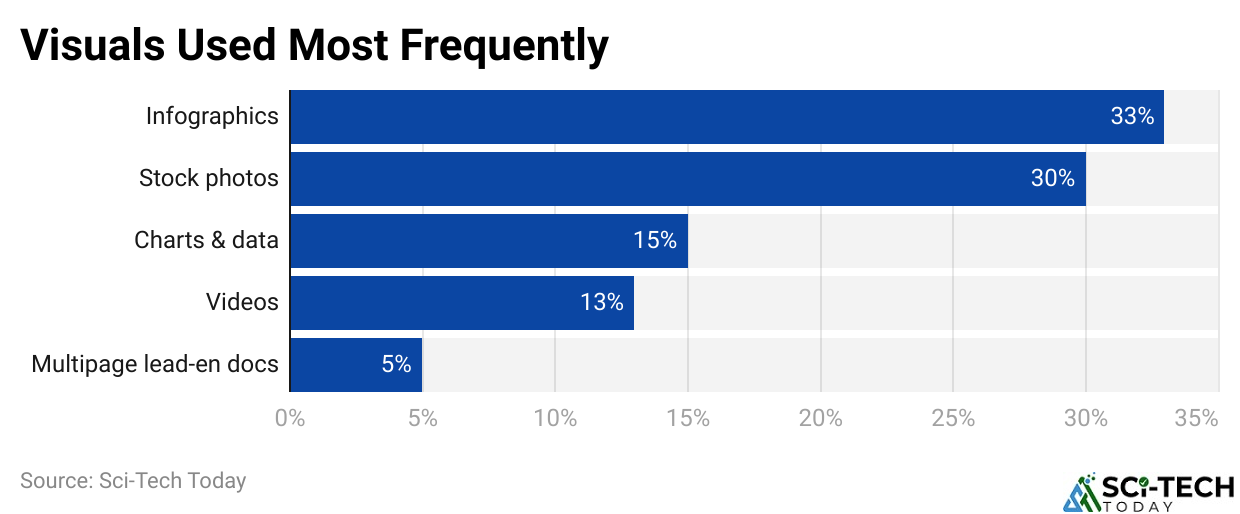
- In a revelation from HubSpot’s 2022 marketing report made in conjunction with infographic maker Venngage, it was stated that out of the number of marketers who produce visual content, the preponderant part, which is about 33%, uses infographics and illustrations.
- Infographic statistics show that the other types included stock photos, which accounted for 30%, charts and data visualisations at 15%, videos and presentations at 13%, and multipage lead-generation documents, which made up 5%.
- It is thus a clear representation of the dominance of infographics and illustrations over other types of visual content in its visual content strategy.
Infographics Statistics By Visual Content
- Infographic statistics carried out by Canva globally involving 1,600 business leaders showed that 53% of the business executives think their contents lack some kind of aesthetic appeal, whilst 56% indicated that their content is inconsistent.
- Then, 64% also stated that their employees lack the tools to create impactful content. This fact exhibits a large gap between marketing and design teams.
- According to the Canvas Visual Economy report, 32% of business leaders worldwide indicated their intention to improve communication with a more visual approach, whereas 29% expressed their intention to adopt faster catering visuals in their workplaces.
- The infographic statistics further revealed that about 25% of the leaders whose companies have heavy text presentations admitted that their attention spans dropped.
- There is more indication of this being caused by elements like the increased use of graphic design tools (27%), the rise of visual-based social media platforms (26%), and the increased use of video communication tools like Zoom (25%).
Infographics Statistics By Visual Tools
- Multiple-slide presentations are another form of infographic intended to present data and information appealingly to draw attention.
- As a design platform, Canva is regarded as the most popular of all: it has been used to create over 1 billion presentations.
- In the preceding twelve months before the report from Canva, LinkedIn profiles listing “Canva” as a skill grew at a rate of 105%.
- This huge growth considers the fact that higher demands are escalating visibility, even to non-design professionals who experience the need to have skills in visual communication tools like those of Canva.
- In the report, 61% of global business leaders expect that team members in non-design roles should be sophisticated at design, while 34% expect them to have a basic understanding.
- Only 4% anticipate limited design knowledge, and just 1% expect no knowledge at all.
- Closing that gap, 63% of business leaders admit that they offer visual design training to non-design employees.
- Canva’s Visual Economy report also revealed that 90% of global business leaders believe that visual communication tools make their organisations more effective, and this proves that visuals are essential in modern professional environments.
Infographics Usage Statistics
- Infographics have an important value in marketing strategies, and 65% of marketers use them as part of their content plans.
- The visual content is processed 60,000 times faster than text, making visuals an important communication tool for marketers.
- In fact, 55% of all marketers consider social media infographics as one of the most important types of visual media over others, and 62% of content creators make infographics almost twice a week at best.
- Instagram and LinkedIn are considered the topmost social media platforms where infographics can be found: 65% of brands include them in their content marketing efforts.
- And even 56% of the industry claims to use infographics in all their marketing activities.
- Presentations with infographics, such as visual aids, are 43% more convincing, and research by Infographic World discovered that 84% of participants regard infographics as very valuable.
- Infographics with colours can improve attention span and learning by 82%.
- Moreover, this shows how much current modern marketing has come to depend on infographics, for 39.7% of U.S. marketers use such online tools for designing infographics and other digital visual content.
Impact of Content Medium On Learning and Information Retention
| Content Medium | Learning & Information Retention Affect |
| Infographics | 61% |
| Commercials | 55% |
| PowerPoint | 48% |
| Articles (with images) | 46% |
| Articles (without images) | 38% |
| Average Ranking Blog Post | 36% |
(Source: searchlogistics.com)
- Dissimilar content formats teach and retain information in different ratios. Infographics topped the charts with a 61% effectiveness score, presenting highly dramatic information in a way that was easy to understand and visually appealing.
- Infographic statistics state that next were commercials, with 55% likely due to the visual appeal of the audio aspects that we remember.
- PowerPoint presentations managed 48%, which often accompanied the more text-based information that would integrate with visual aids that complement presentations.
- Articles with images produced a 46% effectiveness measure that supports the theory that pictures significantly improve understanding and comprehension in readers than text alone.
- In contrast, articles without images show a much lower retention impact of 38%.
- That is indicative of how relevant visuals are proving to be in maintaining reader attention.
- Finally, average-ranking blog posts score the lowest at 36%, emphasising the need for more dynamic and visually rich content to improve retention.
Content Marketing Infographic Statistics
- The year 2023 is expected to be a peak growth year for short-form videos, as it will still be used by marketers as an above-all-the-trends phenomenon.
- In fact, 90% of the advertiser group were on their way to utilising short videos to maximise or sustain business investments as early as 2022.
- Visuals are the most important content type for their companies, and they are used by 32% of marketers. Nearly 30% of marketers, meanwhile, produce visual content to improve the value of their brands.
- However, making visual materials or infographics regularly presents a real challenge to almost 43% of content marketers.
- Infographics are also highly critical in consumer behaviour since 42% of U.S. individuals would rather rely on recommendations made by trusted sources employing infographics before they make any purchases.
- Infographic statistics show that in 2023, it became an immediate priority to have relatable content and trending topics, with 46% of marketers using it for the first time, 49% intending to increase investment, and 43% keeping up in the same way.
- Additionally, original images or visuals have been shown to improve engagement in marketing campaigns by as much as 40%, underscoring the value of unique and compelling visual content.
Conclusion
With all the changes from the previous year to this very moment here in 2024, infographics are still one of the most timely, versatile, and powerful media of communication. They have become more adopted and integrated into marketing, education, and even social media; hence, the relevance of infographics will continue to grow.
A business that invests in quality infographics can achieve much higher engagement rates, a better perception of its brand, and a significant return on its investment. Organisations know how to keep up with the ever-changing picture-dominated world by learning and applying the knowledge behind all these infographic statistics.
