
Energy Drink Statistics By Revenue, Brands and Facts
Updated · Mar 27, 2025


WHAT WE HAVE ON THIS PAGE
- Introduction
- Editor’s Choice
- General Energy Drink Statistics
- Energy Drink Statistics By Region
- Leading Energy Drink Brands In The USA By Sales
- Leading Energy Brands Based On Sales
- Leading Energy Drinks By Brand Awareness
- Per Capita Consumption Of Energy And Sports Drinks (USA)
- Energy Drink Consumers By Age
- Per Capita Energy Drinks Volume Worldwide By Country
- Calories In Energy Drinks
- India Energy Drinks Market Size
- Alcoholic Energy Drinks Statistics
- Conclusion
Introduction
Energy Drink Statistics: Energy drinks have become a significant component of the global beverage industry, with total sales reaching USD 193 billion in 2023. In the United States, per capita consumption averages nearly eight gallons annually, positioning it as the leading market for these beverages. Notably, energy drinks rank as the second most popular dietary supplement among U.S. teenagers and young adults, following multivitamins.
The demographic profile of regular consumers indicates that approximately two-thirds are aged between 13 and 35 years, with males constituting a similar proportion. In Australia, a study revealed that 8% of students consume energy drinks weekly, with higher prevalence among males and those with greater discretionary income. These statistics underscore the pervasive consumption of energy drinks among youth and young adults globally.
Editor’s Choice
- 27% of females and 39% of males regularly consume at least one energy drink every week.
- Energy Drink Statistics show that around 32.5% of young adults are consumers of energy drinks.
- Continuous consumption of such drinks is likely to lead to risky behaviors in young people.
- 24% of consumers of energy drinks are college students who drink at least once a week.
- Majority of American consumers shop for energy drinks at grocery stores or supermarkets.
- In the past 30 days, 85% of smartphone users have shopped for energy drinks through offline mode.
- The combined revenue of out-of-home and at-home markets worldwide is expected to reach $204.5 billion in 2024.
- The volume growth for the energy and sports drinks market worldwide in the at-home segment by 2025 is expected to be 2.2%.
- The majority of energy drink consumers in the USA are aged between 30 and 49, representing 36% of the total.
- Between 2024 and 2028, the American market is expected to increase the per capita consumption of energy and sports drinks by 4.74% in the non-alcoholic drinks segment, reaching 30.9 liters by 2028.
You May Also Like To Read
- Alcoholism Statistics
- Energy Drink Statistics
- Food Truck Statistics
- Tea Statistics
- Wine Industry Statistics
- Yoga Industry Growth Statistics
General Energy Drink Statistics
- Energy Drink Statistics show that around 32.5% of young adults are consumers of energy drinks.
- In addition, in the dietary supplement segment, in the USA, energy drinks are the second most popular drinks.
- Majority of American consumers shop for energy drinks at grocery stores or supermarkets.
- Moreover, in the past 30 days, 85% of smartphone users have shopped for energy drinks through offline mode.
- In 2023, Red Bull sold 12.1 billion cans around the world.
- 27% of females and 39% of males regularly consume at least one energy drink every week.
- 24% of consumers of energy drinks are college students who drink at least once a week.
- Energy Drink Statistics show that 50% of athletes are likely to consume energy drinks before or during sports events.
- Continuous consumption of such drinks is likely to lead to risky behaviors in young people.
- 25% of consumers drink either in the afternoon or evening.
- 22% of active-duty military personnel drink such beverages daily.
- By 2026, the energy shots market is projected to reach $19.4 billion.
- Energy Drink Statistics 2024, shows that around 11.07% of restaurants have listed energy drinks on their menus.
Energy Drink Statistics By Region
Worldwide
- According to Energy and Sports Drink Statistics, the combined revenue of out-of-home and at-home is expected to reach $204.5 billion in 2024.
- Compared to the worldwide population, the average revenue per capita for the at-home segment is expected to be $13.29 in the current year.
- In addition, in global comparison, the United States of America is projected to generate most of the revenue contributing $38,220 million in 2024.
- The volume growth for the energy and sports drinks market worldwide in the at-home segment by 2025 is expected to be 2.2%.
Americas
- Based on Energy Drink Statistics 2024, the combined revenue in the American energy and sports drink market is expected to reach $117.5 billion.
- According to the entire American population, the average revenue per capita in the at home segment is projected to be $41.34 in 2024.
- The average volume per person in a similar segment is estimated to be 8.41L in the current year.
Africa
- The African energy and sports drinks combined market in 2024 is expected to generate a revenue of $9.0 billion.
- Furthermore, the collective volume of out-of-home and at-home consumption is projected to amount to 1.9 billion liters in 2024.
- The average volume per person in the at home category is expected to be 1.39L in the current year.
- Compared to the African total population, the average revenue per capita at home is estimated to amount to $6.38.
Asia
- According to the Energy Drink Statistics, in Asia, the combined revenue is expected to amount to $42.9 billion in the current year.
- In addition, the collective volume will be 10.5 billion L in 2024.
- The average volume per person in the at-home category is projected to reach 2.0L in the Asian market.
- Furthermore, in accordance with the total Asian population, the average revenue per capita at home will be $7.35 in 2024.
Australia And Oceania
- In Australia and Oceania’s energy and sports drink market, the revenue of combined segments such as at-home and out-of-home consumption is expected to amount to $3.8 billion in 2024.
- In relation to the region’s entire population, the average revenue per capita is projected to amount to $42.23 in the current year.
- In addition, the average volume per person in the home segment is projected to reach 7.36L in 2024.
- By 2025, the market is projected to show a volume growth for the at-home category at 2.1%.
Europe
- As of today, the at-home and out-of-home consumption in the European market is expected to generate a revenue of $31.4 billion collectively.
- By 2025, the market is projected to show a volume growth in the at-home segment by 2.8%.
- The average revenue per capita in at-home consumption is expected to be $20.61, compared to the entire European population.
Leading Energy Drink Brands In The USA By Sales
 (Reference: statista.com)
- In 2023, Red Bull recorded the highest energy drink sales in the USA, generating USD 7.34 billion in revenue.
- Monster ranked second with USD 5.52 billion in sales.
- Celsius followed in third place with USD 1.1 billion in sales.
- Bang contributed USD 0.79 million in sales.
- Rockstar achieved USD 0.72 million in revenue.
Leading Energy Brands Based On Sales
 (Reference: statista.com)
- In 2023, Red Bull recorded the highest market share among energy drink brands in the United States, capturing 39.5% of total sales.
- Monster followed with a market share of 29.7%, securing the second position in the U.S. energy drink market.
- Celsius held a market share of 5.9%, reflecting its growing presence in the segment.
- Bang accounted for 4.2% of total energy drink sales in the United States.
- Rockstar contributed 3.9% to the overall market share within the energy drink industry in 2023.
Leading Energy Drinks By Brand Awareness
Based on a survey conducted by Statista, the following chart shows the biggest energy drinks by brand awareness in the USA in accordance with Energy Drink Statistics 2023.
| Brand | Share of Brand |
| Red Bull | 89% |
| Gatorade | 86% |
| Monster | 85% |
| 5-Hour ENERGY | 79% |
| Rockstar Energy Drink | 75% |
| Bang | 60% |
| NOS | 58% |
| Full Throttle | 50% |
| Mountain Dew Energy | 48% |
| PRIME | 46% |
| C4 ENERGY | 41% |
| Reign | 34% |
| Zevia | 30% |
| Relentless ENERGY DRINK | 25% |
| Burn | 23% |
| Carabao ENERGY DRINK | 23% |
| Alani Nu | 22% |
| NOCCO | 18% |
(Source: statista.com)
Per Capita Consumption Of Energy And Sports Drinks (USA)
| Year | Average per capita volume in liters |
| 2018 | 26.93 |
| 2019 | 27.3 |
| 2020 | 26.62 |
| 2021 | 28.87 |
| 2022 | 28.83 |
| 2023 | 29.19 |
| 2024 | 29.53 |
| 2025 | 29.88 |
| 2026 | 30.22 |
| 2027 | 30.56 |
| 2028 | 30.9 |
(Source: statista.com)
- The per capita consumption of energy and sports drinks in the United States is projected to reach 30.9 liters by 2028.
- Between 2024 and 2028, the consumption is expected to grow by 4.74% in the non-alcoholic drinks segment.
- The growth trend between these years is expected to remain stagnant despite the projected increase.
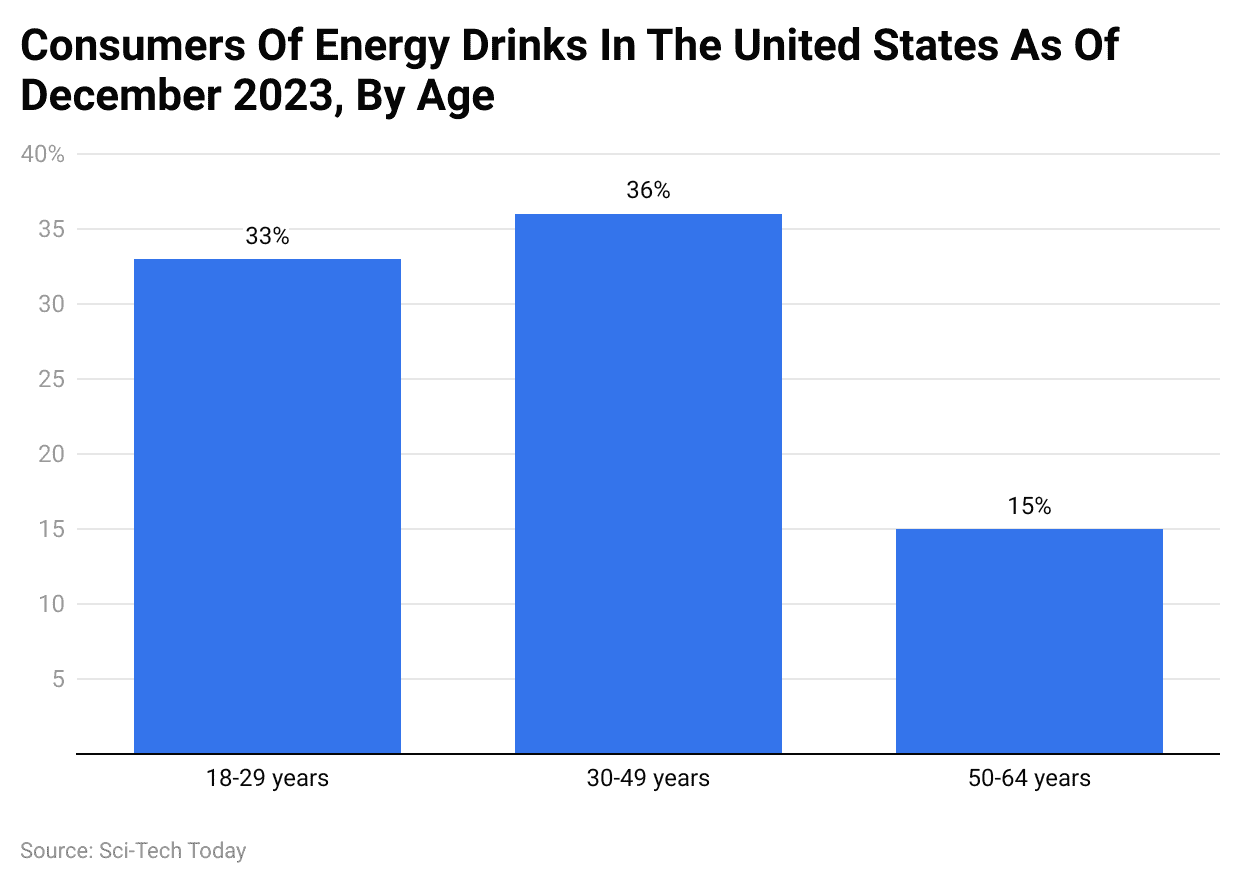
Energy Drink Consumers By Age
 (Reference: statista.com)
- 36% of energy drink consumers in the USA are aged between 30 and 49 years, representing the largest age group.
- 33% of consumers belong to the 18 to 29 years age group.
- 15% of consumers are from the 50 to 64 years age group.
- 66% of energy drink consumers in the USA are male.
- 34% of energy drink consumers in the USA are female.
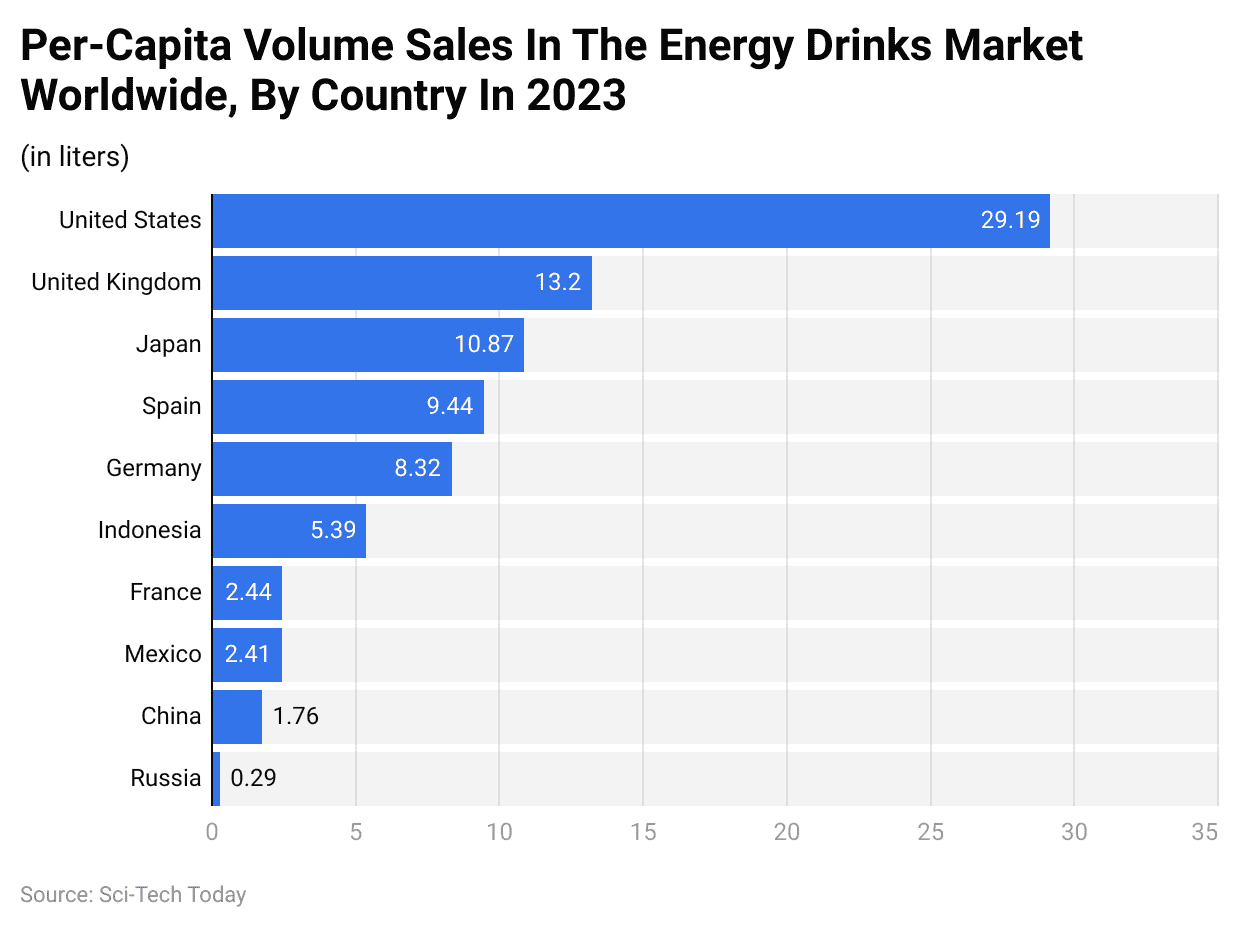
Per Capita Energy Drinks Volume Worldwide By Country
 (Reference: statista.com)
- In 2023, the United States of America recorded the highest per capita energy drink consumption, amounting to USD 29.19.
- The United Kingdom followed with a per capita volume valued at USD 13.20.
- Japan ranked next with USD 10.87 in per capita consumption.
- Spain was among the top countries with a per capita energy drink volume of USD 9.43.
- Germany recorded USD 8.26 in per capita consumption.
- Indonesia followed with USD 7.61 per capita.
- France reported a per capita volume of USD 7.40.
- Mexico registered USD 7.12 in per capita energy drink consumption.
- China recorded USD 6.79 per capita.
- Russia completed the list with USD 6.33 in per capita volume.
You May Also Like To Read
- Mental Health Statistics
- AI in Healthcare Statistics
- Abortion Statistics
- Vegan Statistics
- Fitness Industry Statistics
- Color Psychology Statistics
- Fitbit Statistics
- Health and Wellness Industry Statistics
- Phobia Statistics
- Sleep Statistics
- Depression Statistics
- Social Anxiety Disorder Statistics
- Vitamin and Supplements Industry Statistics
- Breast Cancer Statistics
- Cancer Statistics
- Weight Loss Statistics
Calories In Energy Drinks
Popular Brands
| Sugar-free (1 can serving) | Fat (g) | Carbs (g) | Protein (g) | Calories |
| No Fear Energy | – | – | 1.00 | 10 |
| Rockstar Energy | – | – | – | 20 |
| Red Bull | – | 3.00 | – | 10 |
| Amp Energy | – | – | – | 5 |
| Regular (1 can serving) | Fat (g) | Carbs (g) | Protein (g) | Calories |
| Amp Energy Overdrive | – | 58.00 | – | 220 |
| Monster Energy | – | 27.00 | – | 100 |
| Red Bull | – | 28.00 | – | 110 |
| Rockstar Energy | – | 31.00 | – | 140 |
| Popular types and popular serving sizes | Fat (g) | Carbs (g) | Protein (g) | Calories |
| Fruit Flavoured Sports Drink, 1 cup or 8 fl oz serving | 0.24 | 16.49 | – | 66 |
| Low-Calorie Fruit Flavoured Sports Drink, 1 cup or 8 fl oz serving | – | 7.20 | – | 26 |
| 1 cup (8 fl oz) | 0.19 | 26.26 | 0.60 | 108 |
| 1 bottle (12 fl oz) | 0.29 | 39.38 | 0.90 | 162 |
| 1/2 cup (4 fl oz) | 0.10 | 13.13 | 0.30 | 54 |
(Source: fatsecret.com)
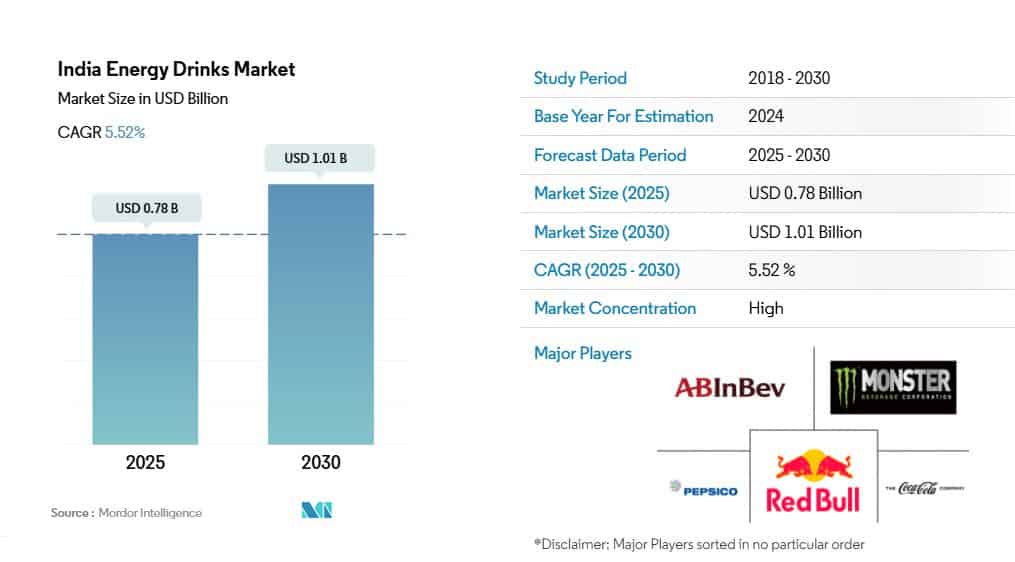
India Energy Drinks Market Size
- The India Energy Drinks Market is estimated to be valued at USD 0.78 billion in 2025 and is expected to reach USD 1.01 billion by 2030, growing at a CAGR of 5.52% during the forecast period.
- Traditional energy drinks will hold approximately 29% of the market share in India in 2024, supported by established brands and expanding domestic product lines.
- Natural and organic energy drinks in India are projected to grow at a rate of 7% from 2024 to 2029, driven by demand for healthier alternatives and natural ingredients such as guarana, yerba mate, and green tea extract.
- Energy shots and other functional beverage variants are emerging in India, targeting niche segments such as sports performance, mental focus, and recovery.
- PET bottles will account for approximately 50% of the Indian energy drinks packaging market in 2024 due to their lightweight nature, cost efficiency, and design flexibility.
- Glass bottles are projected to grow at approximately 7% between 2024 and 2029, driven by rising demand for sustainable and premium packaging options.
- Metal cans are gaining momentum for their recyclability, durability, and premium appeal, especially among younger consumers and premium energy drink brands.
- Supermarkets and hypermarkets dominate the distribution landscape, holding approximately 53% of market share in 2024, due to their extensive product variety, promotional strategies, and over 22,000 modern retail outlets in India.
- The on-trade channel, including bars and clubs, is projected to grow at approximately 9% from 2024 to 2029, influenced by urban nightlife trends and the use of energy drinks as cocktail mixers.
- The online retail channel benefits from 759 million active internet users as of 2023, enabling expanded digital reach and consumer convenience.
- The gaming community, consisting of approximately 421 million online gamers in 2022, represents a significant consumer segment for energy drinks in India.
- Approximately 28% of Indian consumers consistently opted for organic food products in 2022, reflecting broader health-conscious trends that impact the energy drinks sector.
- Over 65% of India’s population is under the age of 35, contributing to rising demand for energy-boosting beverages that align with youthful lifestyles.
- Around 77 million adults in India have diabetes, with an additional 25 million classified as prediabetic, driving demand for sugar-free energy drinks.
- Approximately 36% of the urban population in India participates in sports or physical activity, contributing to demand for energy drinks in fitness-related consumption.
- Manufacturers’ sustainability efforts have resulted in up to 90% recycling rates for PET bottles, with a shift toward returnable glass bottles and other eco-friendly packaging alternatives.
Alcoholic Energy Drinks Statistics
- Excessive alcohol consumption is responsible for approximately 93,000 deaths each year in the United States.
- Individuals aged 15 to 23 who mix alcohol with energy drinks are four times more likely to engage in binge drinking.
- People who combine alcohol with energy drinks are more likely to report experiencing unwanted sexual encounters and other crimes.
- In 2020, consumers spent more than $45 billion on energy drinks, and sales are expected to continue to increase.
- Many energy drinks in international markets contain alcohol as an ingredient.
- The 2020–2025 Dietary Guidelines recommend avoiding the combination of alcohol with energy drinks.
- Caffeine can mask the depressant effects of alcohol, but it does not affect how alcohol is metabolized by the body.
- In November 2010, the United States Food and Drug Administration (FDA) took regulatory action against companies that produced alcoholic energy drinks.
- High caffeine intake can lead to cardiovascular issues, including problems with the heart and blood vessels.
Conclusion
Energy drinks can provide a temporary energy boost, but they have potential drawbacks. If you’re looking for sustained energy, prioritize healthy habits like sleep, a balanced diet, and staying hydrated. However, if you do choose an energy drink, be mindful of the ingredients, consume it in moderation, and avoid it if you have any underlying health conditions.
Therefore, the conclusion of Energy Drink Statistics is that a responsible approach to energy management is key to maintaining physical and mental well-being in the long run.

Tajammul Pangarkar is the co-founder of a PR firm and the Chief Technology Officer at Prudour Research Firm. With a Bachelor of Engineering in Information Technology from Shivaji University, Tajammul brings over ten years of expertise in digital marketing to his roles. He excels at gathering and analyzing data, producing detailed statistics on various trending topics that help shape industry perspectives. Tajammul's deep-seated experience in mobile technology and industry research often shines through in his insightful analyses. He is keen on decoding tech trends, examining mobile applications, and enhancing general tech awareness. His writings frequently appear in numerous industry-specific magazines and forums, where he shares his knowledge and insights. When he's not immersed in technology, Tajammul enjoys playing table tennis. This hobby provides him with a refreshing break and allows him to engage in something he loves outside of his professional life. Whether he's analyzing data or serving a fast ball, Tajammul demonstrates dedication and passion in every endeavor.


