
Introduction
Customer Service Statistics: Customer service is a crucial component of business operations, significantly affecting customer retention and revenue generation. Research shows that 88% of customers are more likely to make repeat purchases when they receive excellent customer service. On the other hand, U.S. companies lose approximately USD 75 billion each year due to poor customer service.
Consumer expectations have evolved; 80% of consumers believe that the experience a company provides is just as important as its products and services. Additionally, 45% of consumers expect their issues to be resolved during their first interaction.
The use of artificial intelligence (AI) in customer service is increasing, with 56% of companies currently employing AI-powered chatbots to improve their operations. Projections indicate that by 2025, 85% of customer interactions will be managed without human intervention, thanks to advancements in AI. However, the human touch remains essential, as 80% of consumers expect to interact with a live agent when they contact a company.
These statistics illustrate the vital role of exceptional customer service in building loyalty and driving business success.
Editor’s Choice
- 93% of customers are more likely to make repeat purchases with companies that offer excellent customer service.
- 89% of companies believe customer service is key to keeping customers.
- 90% of consumers are more likely to make another purchase after a positive customer service experience.
- 80% of customers consider a company’s experience to be as important as its products and services.
- 80% of customers have switched brands because of poor customer experience.
- 60% of Americans will walk away from a brand they like after several bad experiences, with 17% doing so after just one bad experience.
- U.S. companies lose approximately USD 75 billion annually due to poor customer service.
- Increasing customer retention rates by just 5% can increase profits by 25% to 95%.
- Companies with omnichannel strategies achieve approximately 89% customer retention, compared to 33% for those without.
- 73% of consumers stay loyal to brands with friendly customer service agents.
- 75% of customers prefer talking to human agents for complex problems.
- 69% of consumers try to solve issues on their own before reaching out to customer service.
- More than 60% of consumers prefer resolving simple issues through self-service channels.
- 53% of consumers say they always have to repeat their reason for calling while talking to multiple agents.
- 71% of consumers feel frustrated when a shopping experience is impersonal.
- 71% of consumers believe that brands already know why they are calling.
- 74% of online adults feel a stronger connection with businesses that offer direct messaging options.
- 79% of consumers expect a response on social media within 24 hours.
- 87% of consumers read online reviews about local businesses’ customer service.
- 52% of customers make additional purchases after a good customer service experience.
- Consumers of automotive and financial services are equally likely to call customer service if they don’t find what they are looking for online, contributing 33%.
- Travel consumers have the highest share in making purchases over calls at 61%, compared to 18% for automotive consumers.
- 30% of consumers call brands to make high-investment purchases, while 44% do it for research purposes.
- Replacing a single customer service agent can cost upwards of USD 10,000.
- 58% of customer service managers view AI as a game-changer, automating tasks and offering personalized experiences.
- 66% of customer service professionals report that AI has a positive impact on business performance.
- Only 25% of call centers have successfully integrated AI automation into their daily operations.
- 76% of employees report higher engagement when experiencing empathy from their leaders.
- 87% of contact center agents report that their job causes stress.
- Consumers hang up quickly when asked to hold, with 5% disconnecting immediately, 28% hanging up within five seconds, and 26% waiting 6 to 10 minutes. Only 6% are willing to wait 30 minutes or more.
- 49% of individuals would feel thankful if their calls were not transferred.
- The insurance and healthcare industries receive the highest number of customer calls when consumers are about to make a purchase.
- Acquiring new customers is 5 to 10 times more expensive than retaining existing ones
General Customer Service Statistics
- Customers are ready to pay 16% more if they experience great customer service.
- 97% of consumers vote for customer service to be crucial for brand loyalty.
- Customer Service Statistics report that compared to the 80% calls per 15-second standard, companies are likely to opt for 90% answered calls.
- 87% of consumers would feel more confident about direct purchases compared to online shopping if they could talk to a real person in customer service.
- 79% of the calls get rerouted at least once.
- 53% of consumers say they always have to repeat their reason for calling while talking to multiple agents.
- Around 40% of the leaders in customer service believe that their companies view customer service as an expense rather than an important growth factor.
- According to Accenture, when customer service is considered a business value, it becomes a base for business growth.
- 36% of business leaders believe automation supports enhancement in business revenue.
- 68% of C-level executives said retaining customers has become difficult compared to last year.
- When consumers are asked to hold, 5% are likely to hang up in the same second, while 28% cut the call after 5 or less. 26% wait at least 6 to 10 minutes, while only 6% would wait for 30 minutes or more.
- According to McKinsey, two-thirds of millennials prefer real-time customer support.
- 78% of consumers have canceled their transactions because of a bad customer experience.
- Customer Service Statistics report that 70% of buyers purchase based on how they are treated.
By Consumer Behaviour
- Compared to AI interaction, 50% prefer human interaction, while 31% of customers want both.
- 68% of consumers, when calling customer service departments, expect customer representatives to have enough product knowledge.
- Furthermore, more than 60% of the individuals will prefer brands that recommend the products or services they like.
- Customer Service Statistics report that 94% of consumers are likely to make another purchase if they are offered good customer service.
- Furthermore, 75% of the customers say they forgive the company’s mistakes after receiving excellent service.
- 48% of the customers choose other brands that offer better customer service.
- 19% of customers said the most frustrating thing about customer service is that the issue is not resolved on the first attempt.
- 71% of consumers say they believe that brands already know why their customers are calling them.
- Customer Service Statistics state that 49% of individuals would feel thankful if the calls were not transferred.
- 30% of the consumers call brands because they directly want to make high-investment purchases over the phone, while 44% do it for the research process.
- When given personalized services, 80% of buyers are more likely to purchase from the same brands.
- In addition, Customer Service Statistics show that 63% of people are ready to share personal information with companies that offer great customer service.
- Based on a PwC report, 42% of people are likely to pay more when offered friendly customer service.
By Consumer’s Habit of Calls
- Travel consumers have the largest share in making purchases over calls, compared to automotive consumers, with 61% and 18%, respectively.
- Consumers of automotive and financial services are equally likely to call customer service if they don’t find what they are looking for online, contributing 33%.
- Furthermore, the same share applies to healthcare consumers, with 30%.
- 25% of the customers feel frustrated if they are unable to connect with customer service agents through social media or email.
By Customer Data Challenges
According to an executive research report, Outsmarting Adversities | Customer Service Trends & Opportunities, by CCW Digital 2023, surveyed companies have responded to various challenges in either way as follows.
| Problem | Yes | No |
| Not collecting enough meaningful data about customers | 50.50% | 49.50% |
| Not unifying the data we are collecting from different channels, functions, etc. | 64.21% | 35.79% |
| Not sufficiently analyzing data / not generating enough actionable takeaways, root causes, etc | 67.22% | 32.78% |
| Not using data to improve CX operations, including self-service, agent training, journey archestration, etc | 62.54% | 37.46% |
| Not providing frontline employees with data to deliver relevant, personalized experiences | 58.19% | 41.81% |
| Not sharing data outside the CX/ contact center to spur overall business results | 54.70% | 45.30% |
(Source: prod2-sprcdn-assets.sprinklr.com)
By Areas of Investment As a Part of CX
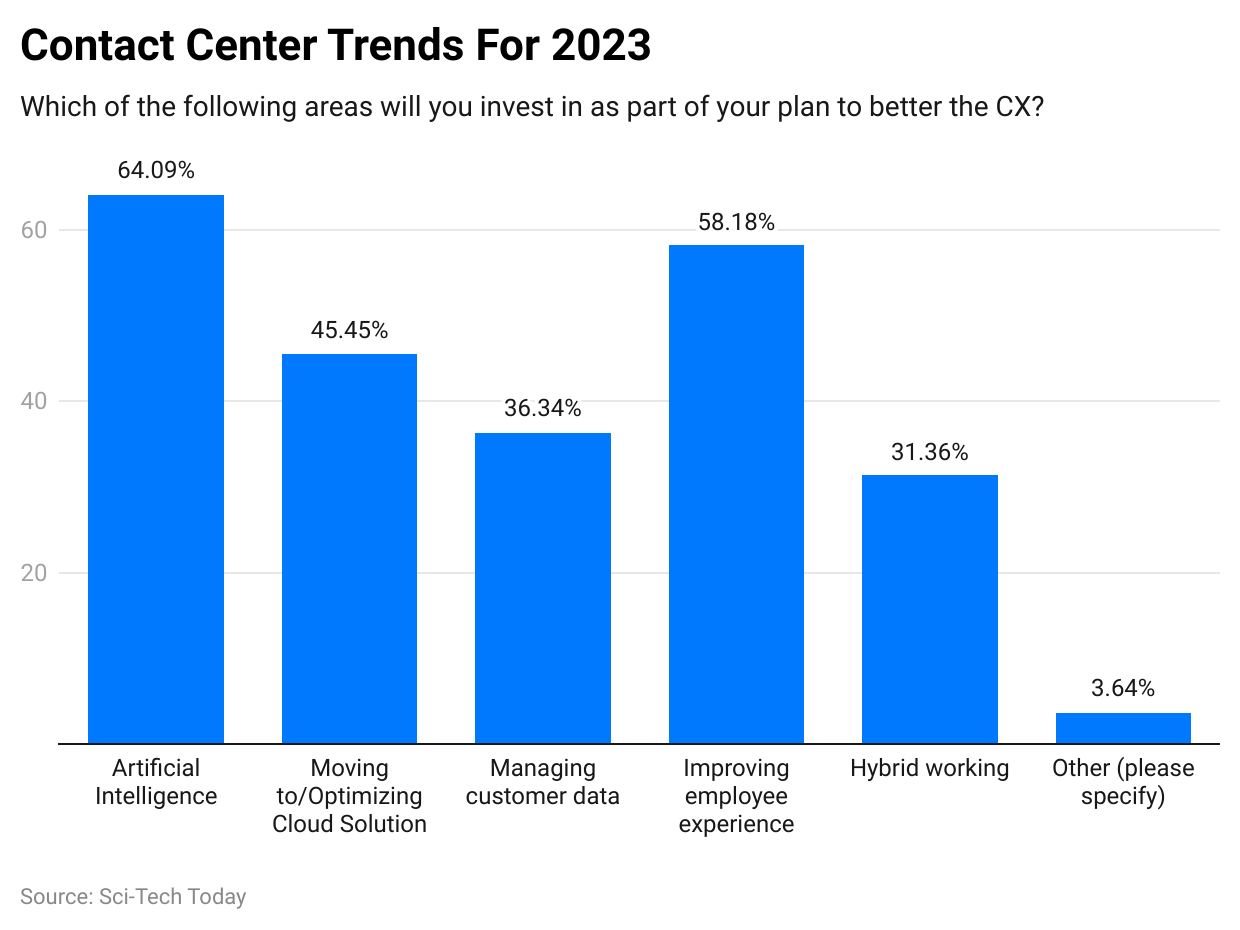
(Reference: prod2-sprcdn-assets.sprinklr.com)
- The majority of Customer Experience (CX) leaders prioritize investment in Artificial Intelligence (AI).
- 63.64% of CX leaders prefer investing in customer data management.
- Significant investments are being made in cloud solutions, focusing on migration and optimization.
- Hybrid working models are a key area of investment to enhance workplace flexibility.
- Employee experience improvements remain a crucial focus to drive higher engagement and productivity.
By Industries With the Most Customer Calls
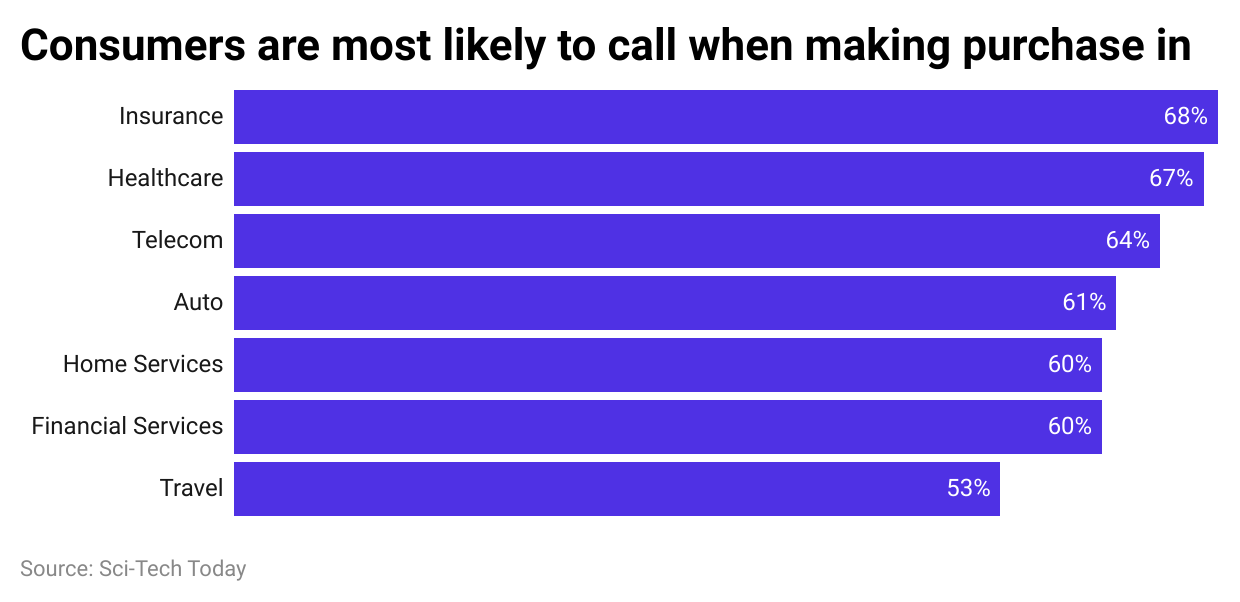
(Reference: invoca.com)
- The insurance industry receives the highest number of customer calls when individuals are about to make a purchase.
- The healthcare industry ranks second with a slightly lower volume of customer calls.
- 64% of customer service calls are made to the telecom industry.
- 61% of customer service calls are directed to the automobile industry.
- 60% of customer inquiries are received by home services.
- 60% of customer calls are made to financial services.
- 53% of customer service calls are related to the travel industry.
By Poor Customer Experiences Cost Business
- According to Customer Service Statistics, 74% of consumers will not go with the brand if they have a bad customer experience.
- 32% of the customers are likely to avoid brands after just one bad experience.
- Every year in the USA, bad customer service costs around $1.6 trillion.
- Customer Service Statistics study states that it requires 12 positive experiences to recover from only one bad experience.
- Acquiring new customers is likely to cost 5 to 10 times more compared to taking care of old customers.
- The top reason for customers to avoid calling customer service is long wait times.
By Preferred Communication Channels
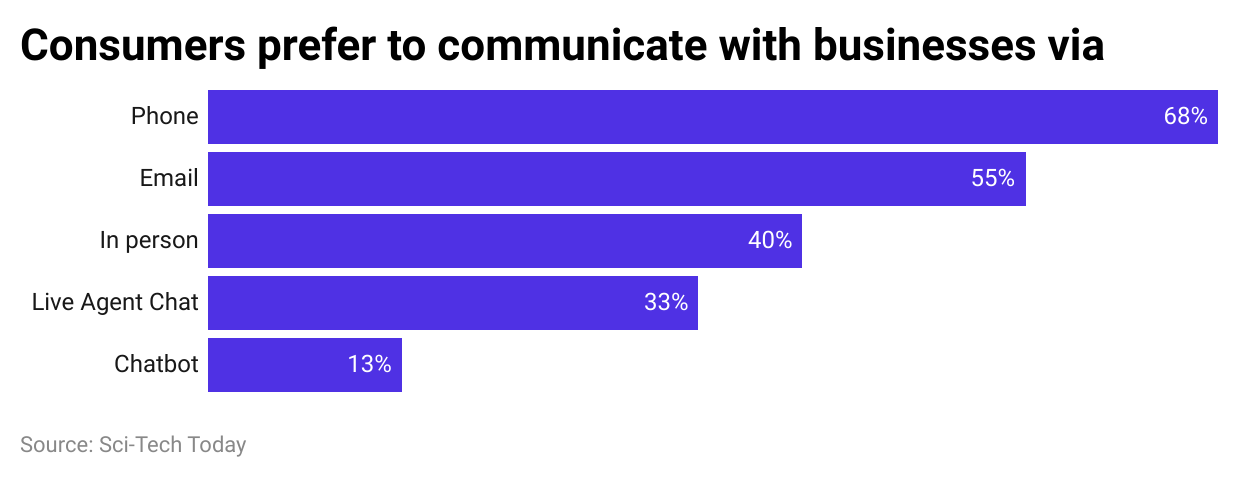
(Reference: invoca.com)
- 68% of customers prefer to connect with customer service via phone.
- A little more than 50% of customers choose email as their preferred communication channel.
- 40% of customers prefer to communicate in person.
- 33% of customers opt for live agent chat for customer service interactions.
- Only 13% of customers prefer to interact with a chatbot.
Contact Channels Supported By Customer Service Teams
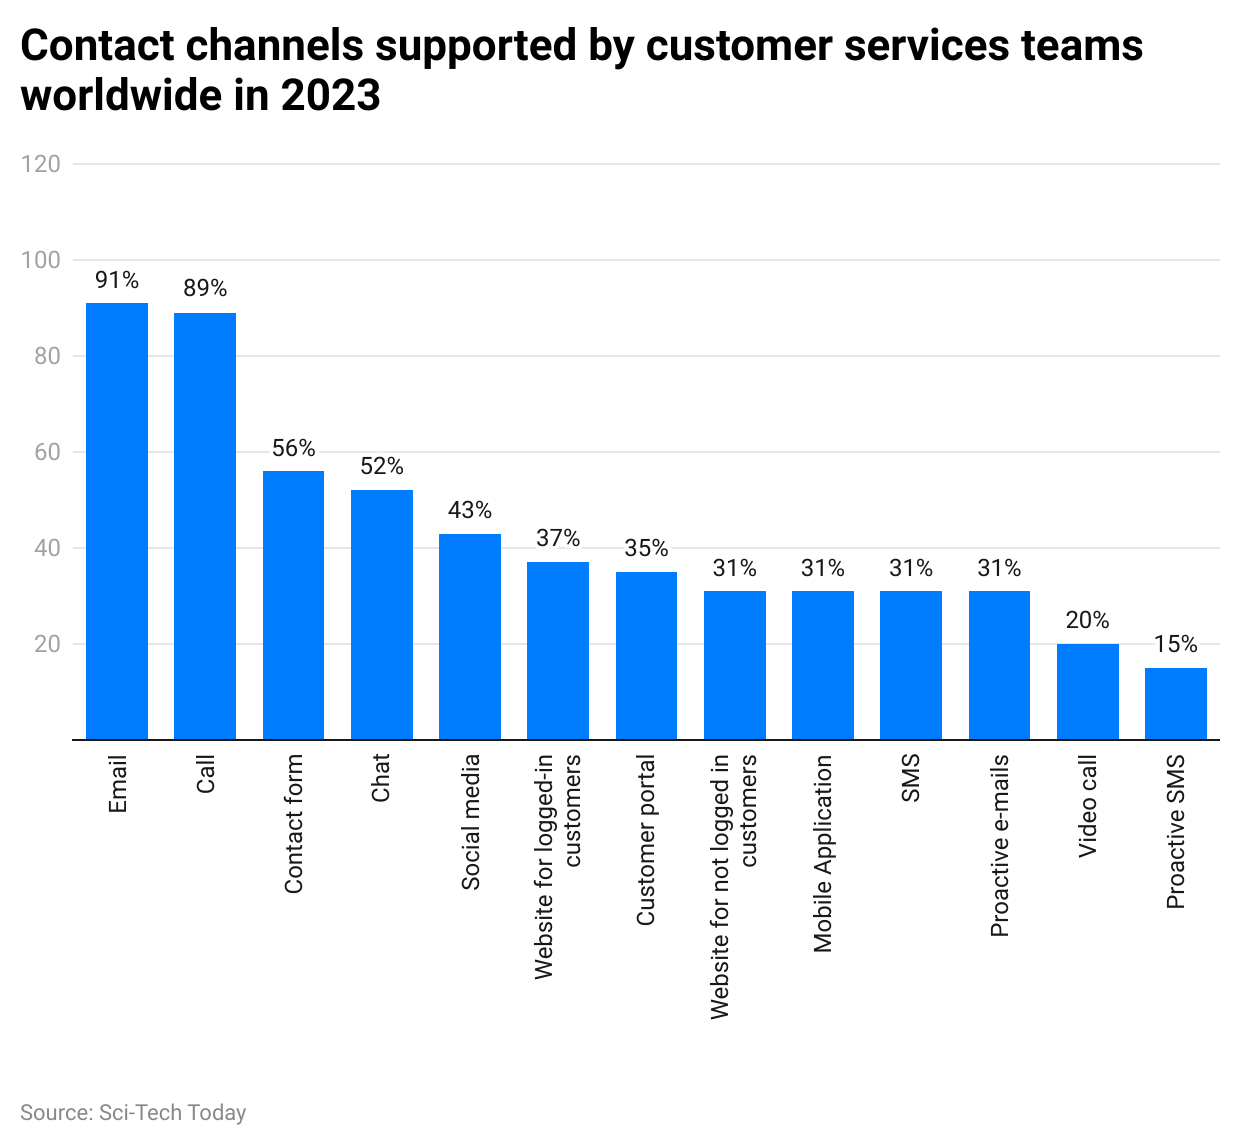
(Reference: statista.com)
- In 2023, more than 90% of customer service teams worldwide supported email as their primary contact channel.
- 89% of customer service teams provided support via calls.
- Other supported channels included:
- Contact forms
- Live chat
- Social media
- Websites for logged-in customers
- Customer portals
- Websites for non-logged-in customers
- Mobile applications
- SMS and proactive email were also utilized as communication channels.
- Video calls and proactive SMS were among the least frequently supported contact options.
By Reasons to Contact Customer Service
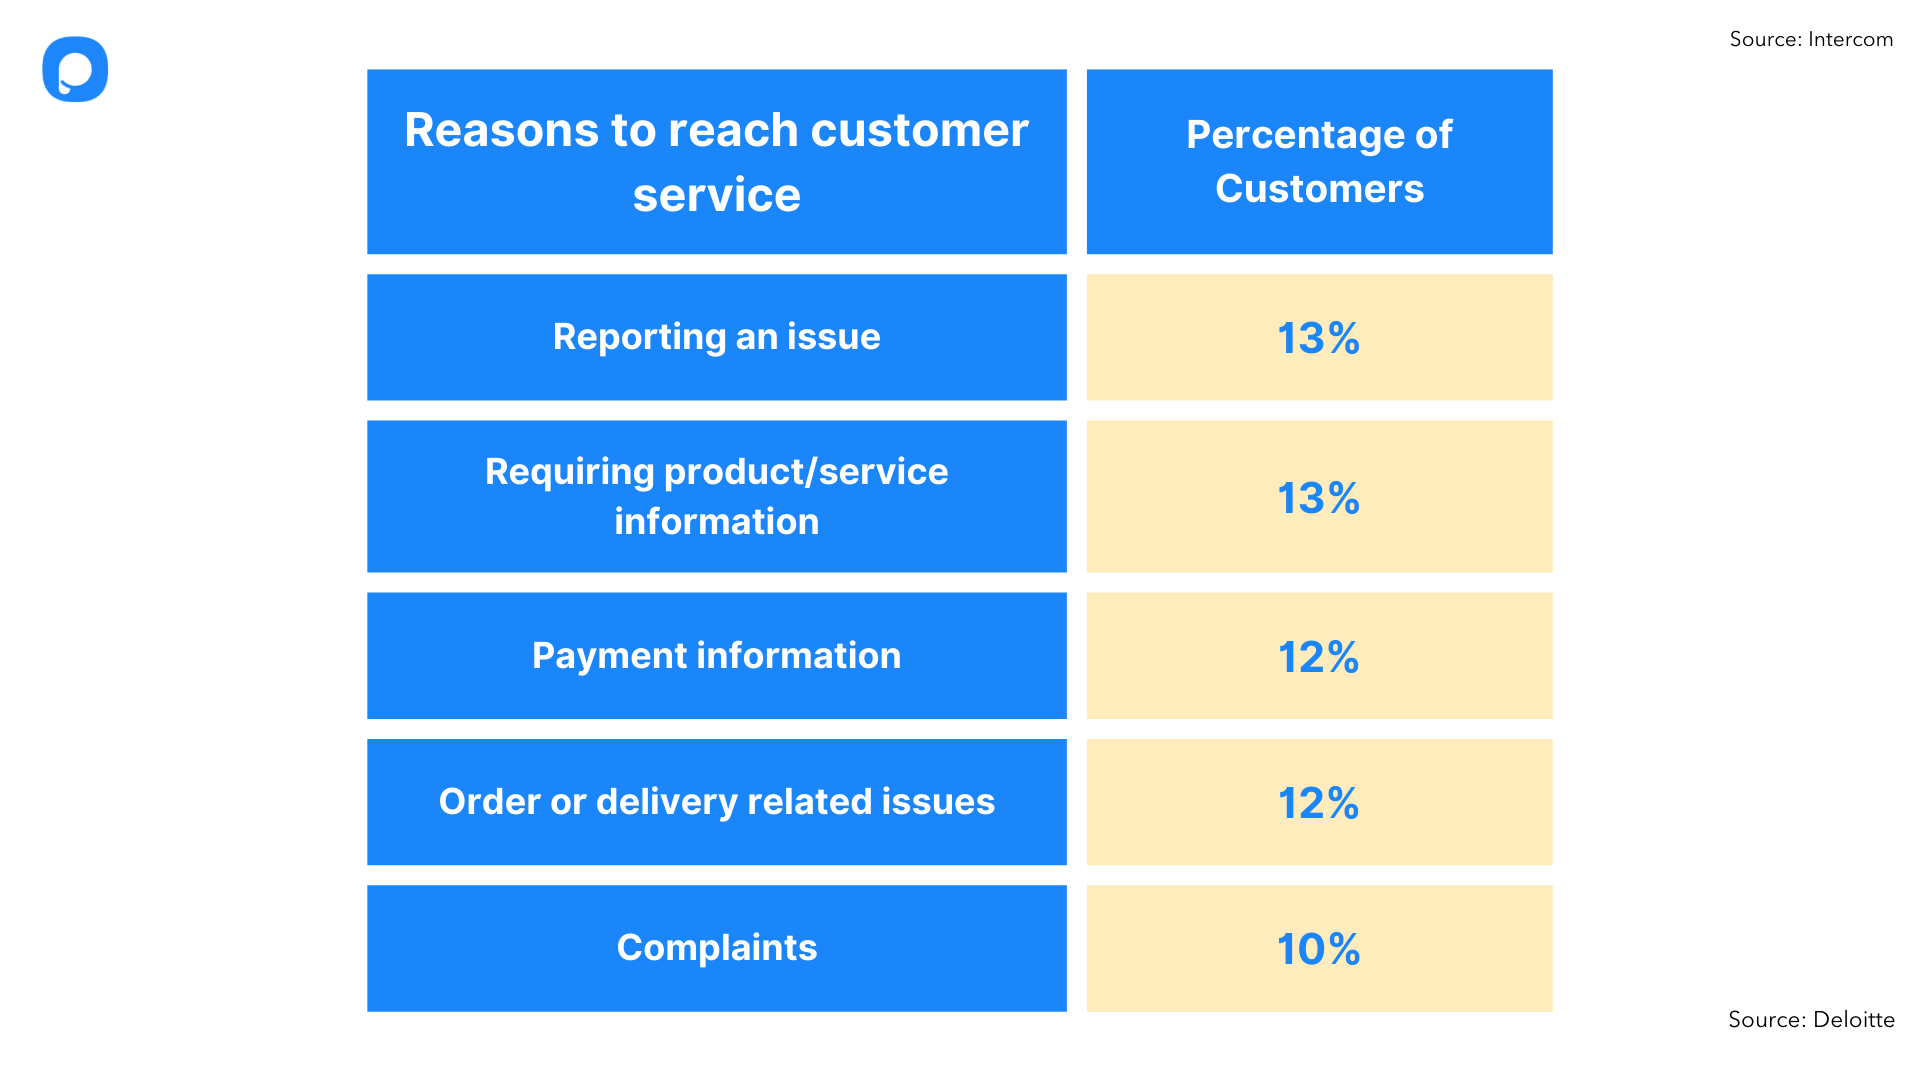
(Source: popupsmart.com)
- 13% of customers contact customer service to report issues.
- 13% of customers reach out to inquire about products or services.
- 12% of customers contact customer service regarding payment information.
- 12% of customers seek assistance for order or delivery-related problems.
- 10% of customers call to file complaints.
U.S. Consumer Support for Brand’s AI Customer Service by Generation
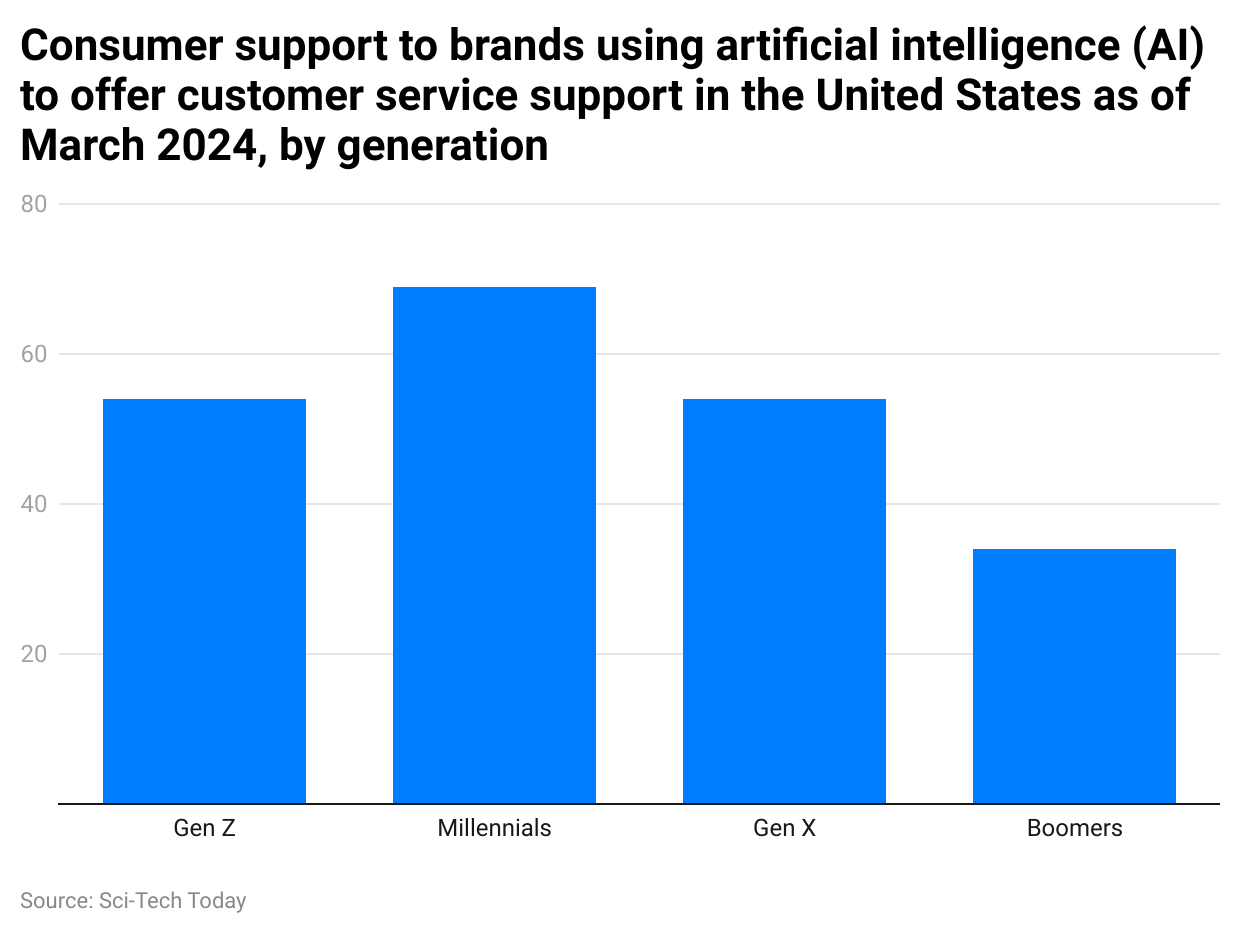
(Reference: statista.com)
- 69% of Millennials support the application of AI in customer service.
- 54% of Gen Z and 54% of Gen X also express support for AI in customer service.
- The lowest support is observed among Baby Boomers, with only 34% in favor of AI customer support.
By Customer Satisfaction Score by Industries
According to a press release by JD Power, the following chart explains the best automotive companies with the highest customer service index in 2024.
| Premium Brands | Score (on 1,000-point scale) |
| Lexus | 897 |
| Porsche | 894 |
| Cadillac | 883 |
| Infiniti | 882 |
| Acura | 870 |
| Jaguar | 869 |
| Alfa Romeo | 867 |
| Segment Average | 866 |
| BMW | 862 |
| Mercedes-Benz | 858 |
| Audi | 854 |
| Lincoln | 853 |
| Land Rover | 850 |
| Volvo | 849 |
| Genesis | 812 |
(Source: jdpower.com)
By Mass Market Brands
| Brands | Score (on 1,000 point scale) |
| Buick | 887 |
| MINI | 884 |
| Subaru | 877 |
| Mitsubishi | 875 |
| Honda | 863 |
| Chevrolet | 861 |
| Mazda | 861 |
| Nissan | 860 |
| GMC | 852 |
| Toyota | 851 |
| Segment Average | 848 |
| Kia | 838 |
| Jeep | 837 |
| Ford | 835 |
| Dodge | 833 |
| Chrysler | 825 |
| Hyundai | 819 |
| Volkswagen | 819 |
| Ram | 810 |
(Source: jdpower.com)
Top 10 ACSI Scores by Company
According to the American Customer Satisfaction Index report, the following are the Top 10 ACSI Scores by Company in 2024
| Brand Name | Industry type | Current Score | Industry score |
| USAA Bank (available for military-affiliated families and individuals) | Banks | 87 | 80 |
| Chick-fil-A | Fast Food Restaurants | 85 | 78 |
| Costco | Supermarkets | 85 | 79 |
| H-E-B | Supermarkets | 85 | 79 |
| Publix | Supermarkets | 85 | 79 |
| AB InBev | Breweries | 84 | 83 |
| Chewy | Online Retailers | 84 | 80 |
| Coca-Cola | Soft Drinks | 84 | 83 |
| Jimmy John’s (Inspire Brands) | Fast Food Restaurants | 84 | 78 |
| Keurig Dr Pepper | Soft Drinks | 84 | 83 |
| National (Enterprise) | Car Rentas | 84 | 77 |
| Nike | Athletic Shoes | 84 | 77 |
| Skechers | Athletic Shoes
|
84 | 83 |
| Toyota | Automobiles | 84 | 79 |
| Trader Joe’s | Supermarkets | 84 | 79 |
(Source: theacsi.org)
By Fast Food Restaurants
| Brand | 2023 | 2022 | Change |
| Fast Food Restaurants | 78 | 76 | 3% |
| Chick-fil-A | 85 | 83 | 2% |
| Jimmy John’s (Inspire Brands) | 84 | 79 | 6% |
| All Others | 82 | 79 | 4% |
| KFC (Yum! Brands) | 81 | 78 | 4% |
| Papa Johns | 80 | 76 | 5% |
| Domino’s | 78 | 78 | 0% |
| Five Guys | 78 | 76 | 3% |
| Pizza Hut (Yum! Brands) | 78 | 77 | 1% |
| Starbucks | 78 | 77 | 1% |
| Arby’s (Inspire Brands) | 77 | 76 | 1% |
| Dunki’ (Inspire Brands) | 77 | 74 | 4% |
| Panda Express | 77 | 75 | 3% |
| Burger King (RBI) | 76 | 75 | 1% |
| Panera Bread | 76 | 77 | -1% |
| Chipotle | 75 | 77 | -3% |
| Dairy Queen | 75 | 74 | 1% |
| Subway | 75 | 75 | 0% |
| Little Caesars | 74 | 75 | -1% |
| Popeyes (RBI) | 74 | 71 | 4% |
| Wendy’s | 73 | 74 | 1% |
| Jack in the Box | 73 | 72 | 1% |
| Sonic (Inspire Brands) | 72 | 74 | -3% |
| Taco Bell (Yum! Brands) | 71 | 72 | -1% |
| McDonald’s | 69 | 68 | 1% |
(Source: theacsi.org)
By Online Retailers
| Brands | 2024 | 2023 | % Change |
| Online Technology and Office | |||
| GameStop | 76 | 75 | 1% |
| Dell | 78 | 77 | 1% |
| Newegg | 78 | 78 | 0% |
| Staples | 79 | 74 | 7% |
| Best Buy | 79 | 78 | 1% |
| HP Store | 81 | 76 | 7% |
| Apple Store | 78 | 75 | 4% |
| Online MultiMarket | |||
| Amazon | 83 | 84 | -1% |
| Walmart | 76 | 73 | 4% |
| Target | 78 | 79 | -1% |
| eBay | 81 | 76 | 7% |
| Costco | 81 | 79 | 3% |
| Online Home Improvement & Decor | |||
| Wayfair | 77 | 79 | -3% |
| Lowe’s | 78 | 76 | 3% |
| BedBathandBeyond.com | 79 | 76 | 4% |
| Home Depot | 77 | 77 | 0% |
| Online Specialty | |||
| Chewy | 84 | 85 | -1% |
| Etsy | 80 | 80 | 0% |
| Walgreens | 74 | 69 | 7% |
| Groupon | 79 | 74 | 7% |
| Online Apparel and shoes | |||
| Gap | 77 | 80 | -4% |
| Kohl’s | 79 | 79 | 0% |
| Nike | 80 | 77 | 4% |
| Nordstrom | 80 | 79 | 1% |
| Macy’s | 78 | 79 | -1% |
| Other | |||
| Other Companies | 79 | 78 | 1% |
| Online Retailers | 80 | 80 | 0% |
(Source: theacsi.org)
By Drugstores
| Brands | 2024 | 2023 | % |
| Walmart | 82 | 74 | 11% |
| Walgreens | 75 | 75 | 0% |
| CVS | 74 | 75 | -1% |
| Rite aid | 76 | 75 | 1% |
| Drugstores | 77 | 76 | 1% |
| All others | 82 | 80 | 3% |
(Source: theacsi.org)
By Supermarkets
| Brand | 2024 | 2023 | % change |
| Supermarkets | 79 | 76 | 4% |
| Costco | 85 | 82 | 4% |
| H-E-B | 85 | 81 | 5% |
| Publix | 85 | 82 | 4% |
| Trader Joe’s | 84 | 84 | 0% |
| Sam’s Club (Walmart) | 83 | 79 | 5% |
| BJ’s Wholesale Club | 82 | 79 | 5% |
| Target | 82 | 79 | 4% |
| Wegmans | 82 | 80 | 3% |
| Whole Foods (Amazon) | 82 | 79 | 4% |
| Aldi | 81 | 80 | 1% |
| Meijer | 80 | 75 | 7% |
| ShopRite | 80 | 75 | 7% |
| Albertsons Companies | 78 | 76 | 3% |
| Hy-Vee | 78 | 76 | 3% |
| Ahold Delhaize | 77 | 74 | 4% |
| Kroger | 77 | 76 | 1% |
| Giant Eagle | 76 | 73 | 4% |
| Save a lot | 75 | 75 | 0% |
| Walmart | 74 | 71 | 4% |
| All others | 79 | 76 | 4% |
(Source: theacsi.org)
By General Merchandise Retailers
| Brand | 2024 | 2023 | % Change |
| Department Stores | |||
| Dillard’s | 74 | 75 | -1% |
| Kohl’s | 79 | 79 | 0% |
| JCPenney | 77 | 76 | 1% |
| Macy’s | 82 | 79 | 4% |
| Belk | 79 | 75 | 5% |
| Warehouse Clubs | |||
| BJ’s Wholesale Club | 80 | 80 | 0% |
| Costco | 82 | 82 | 0% |
| Sam’s Club (Walmart) | 81 | 81 | 0% |
| Discount Stores | |||
| Dollar General | 72 | 70 | 3% |
| Burlington | 76 | 74 | 3% |
| Dollar Tree | 74 | 71 | 4% |
| Big Lots | 78 | 73 | 7% |
| TJX (TJ Maxx, Marshalls) | 79 | 77 | 3% |
| Hypermarkets | |||
| Walmart | 73 | 70 | 4% |
| Fred Meyer (Kroger) | 75 | Target | 81 |
| Target | 81 | 78 | 4% |
| Meijer | 76 | 75 | 1% |
| General Merchandise Retailers (Overall) | 77 | 75 | 3% |
| All others | 78 | 77 | 1% |
(Source: theacsi.org)
By Full-Service Restaurants
| Brands | 2023 | 2022 | % Change |
| Cracker Barrel | 82 | 77 | 5% |
| Outback Steakhouse | 83 | 77 | 8% |
| Texas Roadhouse | 82 | 80 | 3% |
| LongHorn Steakhouse (Darden) | 82 | 80 | 3% |
| Applebee’s (Dine Brands) | 79 | 73 | 8% |
| Buffalo Wild Wings (Inspire Brands) | 79 | 74 | 7% |
| Red Lobster | 79 | 75 | 5% |
| Chili’s | 77 | 76 | 1% |
| Denny’s | 77 | 75 | 1% |
| Fridays | 77 | 78 | -1% |
| Red Robin | 77 | 77 | 0% |
| IHOP (Dine Brands) | 72 | 73 | -1% |
| Full-Service Restaurants | 81 | 80 | 1% |
(Source: theacsi.org)
(Each industry has different benchmarks, including the following: customer service, speed of checkout process, call center satisfaction, quality and reliability of mobile apps, etc, year on year)
ROI of Exceptional Customer Service
- According to HubSpot Research, 93% of customers are likely to make repeat purchases with companies that provide excellent customer service.
- Additionally, 89% of consumers are more inclined to make another purchase after having a positive customer service experience.
- A significant 86% of customers believe that good customer service turns them into long-term brand advocates.
- Furthermore, 83% of consumers feel more loyal to brands that respond promptly and resolve their complaints effectively.
- Around 80% of companies utilize customer satisfaction scores to analyze and enhance the customer experience.
- Interestingly, 78% of consumers will continue doing business with a company after a mistake if the customer service is exceptional.
- According to Bain & Company, increasing customer retention rates by just 5% can boost profits by 25% to 95%.
- Consumers who rate a company’s service as “good” are 38% more likely to recommend that company to others.
- Moreover, 68% of consumers are willing to pay more for products and services from a brand known for its good customer service.
- Businesses can grow their revenues by 4% to 8% above the market average when they prioritize enhancing customer service experiences.
- Investing in acquiring new customers is 5 to 25 times more expensive than retaining existing ones.
- Seventy-two percent of companies believe they can use analytics reports to improve the customer experience.
- Research shows that an NPS Promoter score corresponds to a customer lifetime value that is 600% to 1,400% higher than a Detractor.
- Additionally, research by Zendesk indicates that nearly 60% of consumers consider good customer service essential to feeling loyal to a brand.
Impact of Poor Customer Service
- According to Zendesk, 80% of consumers would prefer to switch to a competitor after experiencing more than one negative customer service interaction.
- Glance reports that 78% of customers have abandoned a purchase due to a poor customer experience.
- As stated by Khoros, 65% of customers have switched to a different brand because of a negative experience.
- The Qualtrics XM Institute found that only 20% of consumers will forgive a bad experience if they consider the company’s customer service to be “very poor.” In contrast, nearly 80% of consumers will overlook a bad experience if they rate the service team as “very good.”
- Ruby Newell-Legner’s book, “Understanding Customers,” states that it takes 12 positive customer experiences to outweigh a single negative experience.
The Power of Personalization
- 76% of customers expect personalized interactions with businesses.
- Brands that excel at personalization are 71% more likely to report improved customer loyalty.
- 70% of organizations consider personalizing the customer experience (CX) a top priority.
- Brands are increasing their personalization budgets by 29% this year compared to last year.
- 77% of business leaders believe that deeper personalization leads to improved customer retention.
- 79% of business leaders view service data as invaluable for driving personalization efforts.
- 62% of consumers agree that personalized recommendations are more effective than general ones.
- 6 in 10 consumers notice and appreciate receiving personalized recommendations.
- 66% of business leaders believe that personalization reduces customer acquisition costs.
- Nearly two-thirds of consumers expect more personalized service through AI.
- 91% of CX trendsetters believe AI can effectively personalize experiences.
- 56% of CX trendsetters are actively investing in AI for personalization.
- Only 22% of CX traditionalists are investing in AI for personalization.
- 70% of customers say that service agents’ awareness of past sales interactions is essential for retaining their business.
- 80% of customers believe that the experience a company provides is as important as its products or services.
- 63% of consumers expect businesses to understand their unique needs and expectations, with 76% of B2B buyers expecting the same.
- 59% of customers believe that companies need to offer cutting-edge digital experiences to retain their business.
- 90% of people are more likely to trust a company with a strong privacy policy.
- 88% of people trust companies that do not share their personal information without permission.
- 92% of customers appreciate companies that allow them control over the information that is collected.
- 79% of customers are willing to share relevant information in exchange for contextualized interactions where they are immediately recognized.
- 56% of customers do not mind sharing personal information in exchange for better service.
- Only 23% of businesses use social media as a tool to collect and analyze customer data.
- Customer conversion rates can improve by approximately 8% when businesses provide personalized consumer experiences.
- On average, customer service agents only ask for a customer’s name 21% of the time.
Conclusion
The future of customer service lies in a harmonious blend of technology and human expertise. Proven by Customer Service Statistics, AI and chatbots will continue to automate tasks and provide basic support, but they won’t replace the need for skilled customer service representatives.
Companies that can leverage technology while prioritizing the human touch will be well-positioned to create exceptional customer experiences and build lasting brand loyalty
