
Carbon Emissions Reduction Statistics and Facts (2025)
Updated · Mar 17, 2025


WHAT WE HAVE ON THIS PAGE
- Introduction
- Editor’s Choice
- Carbon Emission Reductions By Technology
- Percentage Change In The Carbon Emissions
- Carbon Emission Reduction By COVID-19
- Annual Carbon Emissions Worldwide
- Carbon Emissions From Energy By Region
- Carbon Emissions Reduction By Carbon Pricing
- Change In Carbon Emissions By Drivers
- Carbon Emissions By Most Polluting Countries
- Sectoral Emissions And Policies Insights
- Ways To Reduce Carbon Emissions
- Conclusion
Introduction
Carbon Emissions Reduction Statistics: Carbon emissions continue to grow in most parts of the world. Yet, in some countries, emissions cuts have been seen over a few decades. Other countries can use low-cost, low-carbon technologies to raise their living standards without having to take the high-carbon route already established by rich countries.
Having had to fight a tough fight against global endeavours to reduce emissions within their boundaries, the disparity is unsurprisingly shown in response from nation-states as a direct result of diverse socio-political landscapes. Thus, this article unsurprisingly mentions the figures and key data on carbon emissions reduction statistics that need further improvement.
Editor’s Choice
- Carbon emissions reduction statistics reveal that Strategies like afforestation could potentially reduce emissions from 0.5 gigatons to 10.1 gigatons annually by 2050.
- The year 2020 is remembered for its record fall in the world’s carbon emissions owing to the COVID-19 pandemic, which totalled 2.5 billion tons globally, a 5% reduction.
- Global carbon emissions from fossil fuels and industrial processes stood at 37.01 metric tons in 2023, and we expect an increase of about 1.08% in 2024.
- Since 1990, with its over 10 Gt discharge annually, China has been among the worst emitters. From 1990 to date, emissions increased by approximately 6.1%, while those of the U.S. declined.
- Carbon emissions reduction statistics show that In 2023, the Asia-Pacific emitted CO2 around 18.9 metric tons, the result of the region’s rapid economic growth and increasing energy demand.
- In 2023, atmospheric CO2 was at 421.08 ppm, the highest reading in a single year or a 50% rise since before the Industrial Revolution.
- Carbon emissions reduction statistics indicate that Carbon pricing has been proposed as the tool to reduce worldwide emissions by as much as 12% for less than 1% of global GDP.
- A variant price scheme posits that high-income countries would pay US$75 per ton of CO2, upper-middle-income countries at US$50, and lower-middle-income nations at US$25.
- Roughly half of the G20 emissions are unpriced.
- Natural gas emissions decreased by 1.6% (118 Mt) this year as geopolitical tensions further stressed already-constrained global supplies. Europe saw a 13.5% reduction in gas use.
- In contrast, coal emissions rose by 243 Mt, resulting in the highest-ever total emissions approaching nearly 15.5 Gt.
- Carbon emissions reduction statistics show that China and the U.S. are the world’s carbon kings; of the total CO₂ emitted in 2023, 11.9 billion metric tons came from China, while 4.9 billion metric tons came from the U.S.
- The United States reduced its emissions by 13% between 2010 and 2018, compared with an increase of more than 38% for China. The two countries contribute to around 40% of worldwide cumulative greenhouse gas emissions since the onset of industrialisation.
- Electricity generation from coal has seen emissions grow rapidly in China since about the start of the year 2000, reaching 5.2 GtCO2 in 2023.
Carbon Emission Reductions By Technology
 (Reference: proxy.parisjc.edu:8293)
- Recent carbon emissions reduction statistics reveal that to control global warming, greenhouse gas emissions must be reduced, and carbon must be withdrawn from the air.
- One of the feasible ways to achieve this is tree planting or afforestation, which creates and restores forests.
- Studies propound that there are capacities to pull up weight reduction of carbon dioxide equivalent emissions from the atmosphere from 0.5 to 10.1 metric gigatons possible via these techniques every year by 2050.
- Such a reduction will constitute a significant proportion of the carbon emissions that cause climate change; hence, it is a strategy worth developing in the global war against warming.
- Between 0.4 and 8.6 soil carbon sequestration in croplands and grasslands reduction, between 0.4 and 11.3 bioenergy with carbon capture and storage reductions, between 0.3 and 4.9 biochar reductions, and 0.5 to 4 reductions from enhanced weathering.
Percentage Change In The Carbon Emissions
 (Source: statista.com)
- The year 2020 saw a huge reduction in carbon emissions as people were forced to stay at home during the COVID-19 pandemic, resulting in heavy curbing of travel using carbon-emitting polluters.
- According to an IEA carbon emissions reduction statistics report, December data showed a 2.1% increment in carbon emissions above those of 2019, the first time a month-on-month increase has occurred since the beginning of the year.
- Outside of these months, emissions remained consistently below 2019 levels, mainly because of the pandemic restrictions. They started climbing over the lockdown phase toward the end of the month as economies reopened.
- March and April 2020 recorded the lowest carbon emissions with the severest declines anywhere in recorded history.
Carbon Emission Reduction By COVID-19
 (Source: statista.com)
- Globally-honed carbon emissions reduction projection commissioned by The Guardian shows that carbon emissions may be drastically slashed as high as 2.5 billion tons during the year 2020-an unprecedented 5% drop in total atmospheric CO2 points.
- While many climate analysts expected that this year would see emissions again probing peak levels, the drape of stay-at-home orders affecting 100 million due to COVID-19 has thus far brought a severe reduction of fossil fuel use within the economy-the most because of the year’s sudden increase in demand.
- As in earlier years, carbon emissions have significantly declined on several occasions for most economic reasons.
- The second largest, in one billion tons, was during the recession at the beginning of the 1980s, and another sizable downward dip occurred after the end of World War II, probably due to the abrupt ending of production in military factories.
Annual Carbon Emissions Worldwide
 (Source: statista.com)
- Carbon emissions reduction statistics reveal that the global carbon dioxide emissions from fossil fuels and industrial processes reached 37.01 billion metric tons (GtCO₂) in 2023. The expected increase in emissions for 2024 is 1.08%, resulting in a new record amount of 37.41 GtCO₂.
- Over the past 30 years, global emissions have increased by nearly 60% since 1990. Currently, China is the top emitter in the world by amount, after the USA.
- In fact, this is not always the case; the country’s rapid economic growth and industrialisation over several decades have triggered its emissions to shoot up by thousands of percentage points.
- Since 1990, when China experienced about 450% increase in CO₂ emission, the US, however, has seen a 6.1% decline in its emissions during the same period.
- The USA has been the highest historical contributor to carbon pollution, though. On rare occasions, major world events lead to short-term cutbacks in emissions.
- For example, emissions of CO₂ fell by approximately 5.5% worldwide in 2020, mainly owing to lockdowns and restrictions related to the COVID-19 pandemic.
- In line with this, the global recession led to a close to 2% cutback in 2009.
- The recession of the early 1980s added to the already very significant cutbacks, as shown.
- The largest annual percentage decrease occurred in 1945, at the end of World War I, when emissions fell by 17%.
Carbon Emissions From Energy By Region
(Reference: statista.com)
- Carbon emissions reduction statistics state that Asia and the Pacific contributed to the emission of 18.9 billion metric tons of carbon dioxide (GtCO₂) from energy use in 2023.
- Among these, China emitted more than 10 GtCO₂ annually, making it the highest emitter of the region.
- North America was ranked next, emitting 5.9 GtCO₂, most of which was contributed from the United States.
- In fact, carbon dioxide emissions from energy consumption worldwide have more than doubled since 1970 and reached all-time highs in 2023.
- This rapid increase can be mostly attributed to fast-growing economies and increased energy demands in developing regions.
- In 2023, atmospheric CO2 levels worldwide reached a record high of 421.08 parts per million, about 50% higher than pre-industrial levels.
Carbon Emissions Reduction By Carbon Pricing
 (Source: statista.com)
- During the COP26 climate change conference in Glasgow, UK, the World Economic Forum and PwC released an analysis suggesting that implementing a global price on carbon emissions could cut global greenhouse gases by 12% while costing less than 1% of global GDP.
- The report builds on a proposal from the International Monetary Fund (IMF) earlier this year, which suggests tiered carbon pricing: US$75 per tonne of CO₂ for high-income countries.
- US$50 per tonne for middle-income countries and US$25 per tonne for low-income countries. An infographic using OECD data highlights the significant variation in carbon pricing among major economies.
- Some European nations have adopted strict carbon taxes, but for G20 countries as a whole, the OECD warns that urgent action is needed.
- Currently, about half of all emissions in G20 nations are unpriced, and existing price levels are insufficient to support a successful transition to net-zero emissions.
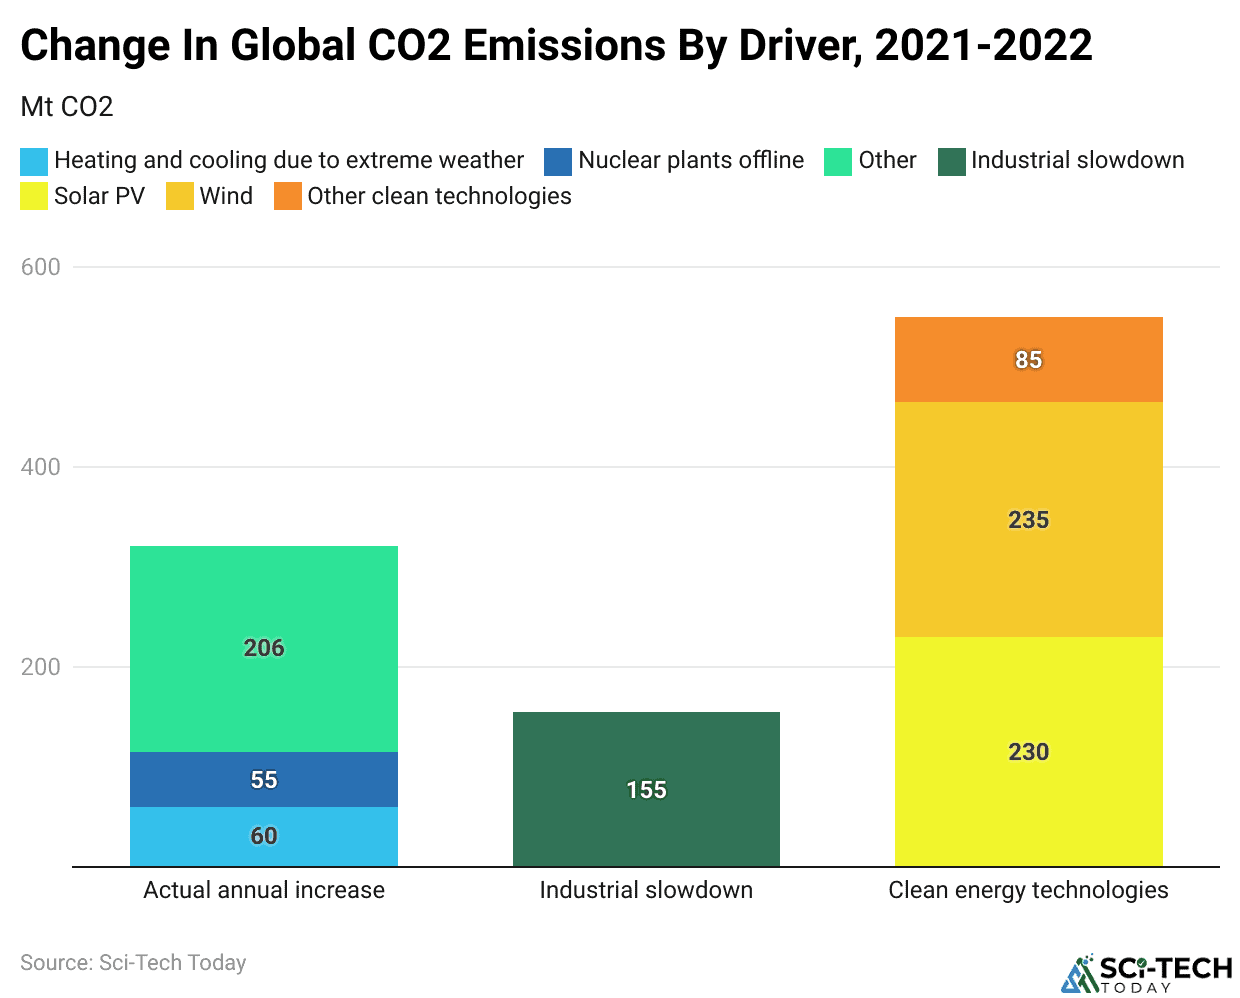
Change In Carbon Emissions By Drivers
 (Reference: iea.org)
- Carbon emissions reduction statistics reveal that gas emissions decreased by 1.6% (118 Mt) less in 2022 due to an increasingly limited gas supply worsened by Russia’s invasion of Ukraine and the associated trade disruptions.
- Most notable reductions were reported in Europe, where emissions decreased by 13.5%, with the most significant decline occurring during the last months of the year.
- Thus, European gas prices remained record-high in 2022 after cutting Russian gas supplies, although it benefitted from a mild winter, which lowered household heating demand.
- High Asian LNG spot prices extenuated a natural gas contract, ultimately registering a reduction in emissions by 1.8%, the highest annual decline recorded in the region.
- In stark contrast, natural gas demand was strong in the United States and Canada, where emissions from gas grew by 5.8%.
- On the other hand, coal emissions increased by 243 Mt, continuing to a new record almost as high as 15.5 Gt.
- This increase of 1.6% has surpassed the average growth observed at a rate of 0.4% per annum in the past decade.
Carbon Emissions By Most Polluting Countries
 (Reference: statista.com)
- Carbon emissions reduction statistics show that in 2023, China and the United States ranked the highest in the world in carbon pollution, emitting 11.9 and 4.9 billion metric tons of carbon dioxide (GtCO 2 ), respectively.
- Although the United States emits the second-largest amount of CO2, emission reductions of about 13% have been made since 2010.
- China, however, has increased emissions by over 38% in the previous years since the same date.
- The power sector accounts for a considerable chunk of global CO2 emissions, with coal-fired power plants being major contributors.
- In China, emissions from coal-based electricity generation have dramatically increased since the beginning of the 2000s, reaching 5.2 GtCO2 in 2023.
- Although the highest annual emitter is currently China, the U.S. has contributed far more historically to carbon emissions, making the U.S. historical emissions of over 400 GtCO2 since 1750. This is chiefly because China has produced most of its emissions in the last two decades.
- Together, the US and China account for nearly 40% of cumulative CO2 emissions since the start of the Industrial Revolution.
Sectoral Emissions And Policies Insights
- Carbon emissions reduction statistics indicate that coal-fired power stations are still among the world’s leading sources of emissions. The 2023 annual increase in energy emissions caused by coal only amounted to 1.1%.
- Drought-related season declines in hydropower are partially responsible for adding 170 million tonnes to emissions that could otherwise fall within the electricity sector’s boundaries.
- The transport sector is one of the biggest offenders, and vehicle electrification and improved fuel efficiency are largely responsible for the hopes of significant future reductions. At present, the specific figures for 2024 emissions in this sector need to be included in open sources.
- Indeed, the European Union’s Emissions Trading System has proved to be a very useful instrument for reducing emissions, with a historical reduction of 16.5% reported in 2023 for the power and industry sectors.
- Also, carbon pricing does work, such as US$10, an increase in carbon taxes yielding a reduction of CO₂ emissions per capita by about 1.3% in the short run and by about 4.6% in the long run.
Ways To Reduce Carbon Emissions
- CCUS technologies are effective in achieving better emission reductions and energy efficiency.
- Initial integration of carbon capture and storage could enable reductions in emissions and, subsequently, cost-related benefits associated with emissions, as well as enhanced reputations of companies over potential competitiveness.
- In cement making, for example, such methods could identify carbon capture methods that can cut emissions by as much as 36% without significantly modifying any production process.
- Of these technologies, amine scrubbing is the most developed but also the most energy-intensive. Liquid amines are injected into the reactor with flue gases, in which CO₂ is incorporated into the liquid. Then, the CO₂ is freed from the amine solvent at high temperatures (120–150 °C) in a steam reactor, regenerating the solvent for recycling.
- Among the new alternatives to carbon capture and storage (CCS) have been solid sorbents for adsorption.
- Metal-organic frameworks, or MOFs, are high-performance physisorbents that can selectively hold CO₂ from flue gas streams.
- Such materials require much less energy for regeneration (<90 °C) than other materials yet display exceptionally high working capacities, moisture resistances, and selectivities.
Conclusion
According to the carbon emissions reduction statistics, there have been considerable reductions in carbon emissions in some parts and sectors, but the universal trend towards an increase in 2025 calls for intensified and sustained efforts. Substantial reductions will require comprehensive policies, technological innovations, and international collaborations to achieve climate goals and mitigate the impacts of global warming.
FAQ.
Such strategies include afforestation and tree planting, which are estimated to sequester between 0.5 and 10.1 gigatons of CO₂ per year by 2050. Other techniques include soil carbon sequestration, bioenergy with carbon capture and storage (BECCS), biochar production, and enhanced weathering; these are among other promising technologies with extensive potential to sequester carbon now and into the future.
During the COVID-19 pandemic, emissions of global CO2 achieved a drastic reduction, which was said to be about 5%, which, in turn, was equivalent to about 2.5 billion tons within the year 2020. The cutbacks were the results of various restrictions imposed on travel, lockdowns, industry, and many more.
The Carbon Asia pacific amalgamations amount to 18.9 billion metric tons in 2023, with China alone contributing over 10 billion metric tons. North America comes second at 5.9 billion metric tons, mainly from the United States.
Carbon pricing, as proposed at the COP26, is going to deliver a reduction of 12% in global greenhouse gases at a cost of less than 1% of the global GDP. In this case, different prices would be charged based on the income level of the country- US$75 per ton of CO₂ for countries of high income, US$50 for middle-income, and US$25 for low-income countries.
By 2023, China will be the biggest emitter of CO2, with an emission value of 11.9 billion metric tons, followed by the United States at 4.9 billion metric tons. The difference is that the United States has decreased its CO2 emissions by 13% since 2010, while CO2 emissions in China increased by over 38% within the same time frame.

Joseph D'Souza founded Sci-Tech Today as a personal passion project to share statistics, expert analysis, product reviews, and experiences with tech gadgets. Over time, it evolved into a full-scale tech blog specializing in core science and technology. Founded in 2004 by Joseph D’Souza, Sci-Tech Today has become a leading voice in the realms of science and technology. This platform is dedicated to delivering in-depth, well-researched statistics, facts, charts, and graphs that industry experts rigorously verify. The aim is to illuminate the complexities of technological innovations and scientific discoveries through clear and comprehensive information.


