
Apple Statistics By Revenue and Facts (2025)
Updated · Mar 18, 2025


WHAT WE HAVE ON THIS PAGE
- Introduction
- Editor’s Choice
- Apple Products, Services and Software
- Apple Facts and Figures
- Apple Revenue Statistics
- Apple Stock Market Statistics
- Apple Statistics By Traffic Sources
- Apple Sales Statistics
- Apple Statistics By Social Media Traffic
- Apple TV Statistics
- Apple Statistics By Web Traffic
- Apple Services Statistics
- Apple Watch Statistics
- Apple Statistics By Device Traffic
- iPhone 15 Statistics
- Apple Statistics By Demographics
- Apple Store and App Store Category Statistics
- Employee Benefits at Apple
- Cost of iPhone For Each Household
- Apple Market Share Statistics
- Conclusion
Introduction
Apple Statistics: Apple Inc., headquartered in Cupertino, California, is a leading multinational technology company renowned for its innovative consumer electronics, software, and services. In fiscal year 2024, Apple reported revenue of USD 391 billion, with the iPhone segment contributing USD 201 billion, accounting for approximately 51% of total revenue. The services division, encompassing offerings such as Apple Music, iCloud, and the App Store, generated USD 96.1 billion, reflecting a year-over-year growth of 12.8%. The company achieved a net income of USD 93.7 billion during this period.
In the fourth quarter of fiscal 2024, Apple reported revenue of USD 94.9 billion, marking a 6% increase compared to the same period in the previous year. This growth was driven by strong demand for iPhones, which saw a 5.5% year-over-year increase to USD 46.2 billion. The services division also experienced growth, with revenue increasing by 11.9% to USD 24.97 billion.
As of December 2024, Apple’s market capitalization reached approximately USD 3.785 trillion, positioning it as one of the world’s most valuable companies. The company’s workforce comprised 164,000 full-time employees as of September 2024.
These figures underscore Apple’s significant role in the global technology industry and its continued influence on consumer electronics and digital services markets.
Editor’s Choice
- Apple reported a revenue of 124.3 billion USD for the first quarter of its 2025 fiscal year.
- Apple’s total revenue for the fiscal year ending September 2024 was USD 391 billion.
- The iPhone segment contributed USD 201 billion, accounting for 51% of total revenue.
- Apple’s services division generated USD 96.1 billion, representing 24% of the company’s total revenue.
- Apple’s net sales in the United States were approximately USD 50.43 billion in the first quarter of 2023.
- Apple earned USD 119.6 billion in the first quarter of 2024.
- Apple’s total brand value was approximately USD 880.5 billion in 2024.
- Apple’s market capitalization stood at approximately USD 3.21 trillion as of December 2024.
- Apple’s price-to-earnings (P/E) ratio was 34.08 as of December 2024.
- Apple’s price-to-sales (P/S) ratio was 8.27 as of December 2024.
- The company had 15.02 billion shares outstanding, reflecting a 2.65% decrease over the past year.
- Institutional investors owned 61.61% of Apple’s shares as of December 2024.
- Apple’s stock price was approximately USD 209.68 in March 2025, reflecting a 3.4% decrease and marking the fourth consecutive trading session of decline.
- In March 2025, Apple announced delays in rolling out significant artificial intelligence enhancements to its Siri voice assistant, causing an 11% decline in stock value during that week.
- Analysts have lowered their forecasts for iPhone sales in 2025, expecting 1% growth instead of the previous 7% forecast due to AI feature delays.
- Apple sold 231 million iPhones, 49 million iPads, and 22 million Mac units in 2023.
- iPhone sales contributed 52% of total revenue in 2023.
- The iPhone held a 28.46% market share in the global smartphone market as of 2024.
- In China, the iPhone had a 24.39% market share as of March 2024.
- Apple News had 125 million active users, growing from 115 million in 2021 to 125 million in 2022.
- Apple TV user statistics by population share were 12.9% in 2024, 13.3% in 2025, and 13.8% in 2026.
- By March 2024, over 42% of Apple’s net sales came from the U.S., and 25% came from Europe.
- Apple earned USD 29.92 billion from marketable securities maturing and USD 107.4 billion from selling these securities.
- The iPhone 15 Pro Max was the most popular model in the iPhone 15 series, making up 35% to 40% of all shipments in 2023.
- 43.4% of all websites utilize WordPress as their content management system (CMS).
- By October 2023, California had the highest number of Apple stores, approximately 54.
- By the end of 2023, Apple employed approximately 161,000 full-time employees, increasing to 164,000 by September 2024.
- By the end of 2025, Apple’s service revenue is projected to reach USD 50 billion.
- Facebook provided 8.61% of Apple’s website traffic, while LinkedIn contributed 7.34%.
Apple Products, Services and Software
Products
- iPhone is a smartphone that runs on iOS and features Siri, Touch ID, Apple Pay, and Face ID on selected models. The 2020 models include iPhone 12, 12 mini, 12 Pro, and 12 Pro Max, all supporting 5G.
- iPad is a versatile tablet powered by iOS, available in various models such as iPad Pro, iPad, and iPad mini. The 2020 update introduced a new iPad Air featuring the A14 Bionic chip.
- Mac is a desktop and laptop computer that runs on macOS. The models include iMac (21.5-inch, 27-inch Retina 4K and 5K), iMac Pro, Mac mini, and Mac Pro. The MacBook Air comes with a Retina display and Touch ID, while the Mac mini features improved performance.
- Apple Watch is a smart wearable device that integrates with Apple’s ecosystem. The Apple Watch Series 3 was introduced in 2017.
- Apple TV is a streaming media player, with the Apple TV 4K launched in 2017.
- HomePod mini, a smart speaker, was introduced in 2020, following the launch of the HomePod in 2017.
- Beats headphones offer high-quality audio performance and are part of Apple’s lineup of audio accessories.
- AirPower, introduced in 2017, is a wireless charging mat designed for multiple Apple devices.
- iPod touch remains available as a portable media player supporting iOS features.
- Apple provides storage options and display accessories to enhance user experience across its ecosystem.
Operating Systems
- iOS is the operating system for iPhones and iPads. The latest update in 2020 introduced iOS 14, which includes improved photo and camera features, an enhanced Siri, and new iPad functionalities.
- macOS is the operating system for Mac computers. The latest update in 2017 introduced new storage, video, and graphics improvements.
- watchOS is the operating system for Apple Watch. The latest update in 2020 included the introduction of Apple Watch SE, an enhanced Siri watch face, improved music options, and personalized activity coaching.
- tvOS is the operating system for Apple TV. It is based on iOS and enables developers to create new apps and games.
Services
Digital Content and Services:
- iTunes Store allows users to buy and download music and videos.
- Apple TV enables streaming of TV shows and movies.
- App Store provides access to apps and in-app purchases for iOS devices.
- Mac App Store allows users to download and install applications for Mac computers.
- TV App Store offers games and apps specifically designed for Apple TV.
- Apple Music provides unlimited music streaming and on-demand radio stations.
- iCloud offers cloud storage for photos, music, contacts, email, documents, and calendars. It includes iCloud Drive, Find My iPhone, iCloud Keychain, Family Sharing, iCloud Photo Library, Notes, Find My Friends, and iCloud Backup.
- Apple Pay enables secure payments using debit and credit cards through contactless payment systems.
- AppleCare provides support and protection plans, including AppleCare Protection Plan (APP) and AppleCare+ (AC+).
- iBooks Store allows users to read e-books on iOS devices and Mac computers.
This version breaks down the information in a straightforward way while keeping the core details intact.
Apple Facts and Figures
- 72,054 patents have been granted to Apple worldwide, with over 55,000 still active.
- In 2021, Apple received more than 2,500 patents in the US, ranking among the top recipients.
- Apple has made 107 acquisitions, spending nearly USD 29 billion in areas such as music technology, artificial intelligence, and image recognition.
- One of the largest acquisitions was Beats Electronics for USD 3 billion in 2014.
- Apple pays a quarterly dividend of USD 0.23 per share, resulting in a dividend yield of 0.70%.
- In fiscal 2022, Apple spent approximately USD 90 billion on stock buybacks, with this amount expected to exceed USD 100 billion.
- By the end of fiscal 2022, Apple had over 100 million Mac users worldwide.
- In the latest quarter, Mac revenue was USD 11.5 billion, an increase from USD 9.18 billion the previous year.
- The first Apple computer, Apple I, was sold in July 1976 for USD 666.66.
- Steve Jobs was fired in 1985 due to disagreements with the CEO and Board of Directors and later returned as CEO in 1997.
- In 1997, Apple was close to bankruptcy when Microsoft’s Bill Gates invested USD 150 million, helping stabilize the company.
- Steve Jobs earned just USD 1 per year as Apple’s CEO for over 10 years, but his net worth exceeded USD 10 billion at the time of his passing in 2011, primarily due to his Apple shares.
- As of March 2022, Apple held USD 202.5 billion in cash and investments, representing 7.4% of the total cash reserves among S&P 500 companies.
- Apple’s cash reserves increased nearly 4% from 2021.
- In comparison, Alphabet held USD 169.2 billion, while Microsoft held USD 132.3 billion, accounting for 5% of S&P 500’s total cash.
- Historically, Apple’s cash reserves were three times larger than those of the US government and twice as much as the UK. At that time, the US government had USD 48.5 billion in reserves.
- The iPad’s popularity increased significantly due to its Retina Display, which was manufactured by Samsung, a key Apple competitor.
- In 1994, Apple introduced the first digital color camera, the Apple QuickTake 100, priced under USD 1,000 with a 640×480-pixel CCD that stored up to eight images.
(Reference: statista.com)
Apple faces competition from various companies depending on the product category:
- Smartphones: Samsung is Apple’s biggest rival in the global smartphone market. Both companies compete heavily, with Samsung having a large share and Apple also making strong sales.
- Personal Computers (PCs): In the PC market, Apple competes with several brands, such as Dell, HP, Lenovo, and Microsoft. Apple has a solid presence but has yet to lead the market compared to these other companies.
- Tablets: Apple is the top player in the tablet market, with competitors including Samsung, Huawei, and Amazon. Apple stays ahead of the competition with its iPad products.
- Smartwatches: Apple leads the smartwatch market with its Apple Watch. Key competitors include Samsung, Fitbit (owned by Google), and Garmin.
To sum up, Samsung is Apple’s major competitor across different product areas, while Apple maintains a leading position in tablets and smartwatches.
Apple Revenue Statistics
- Apple reported a revenue of 124.3 billion USD for the first quarter of its 2025 fiscal year.
- Apple’s yearly revenue was USD 383.29 billion in 2023, down almost 2.8% from the previous year.
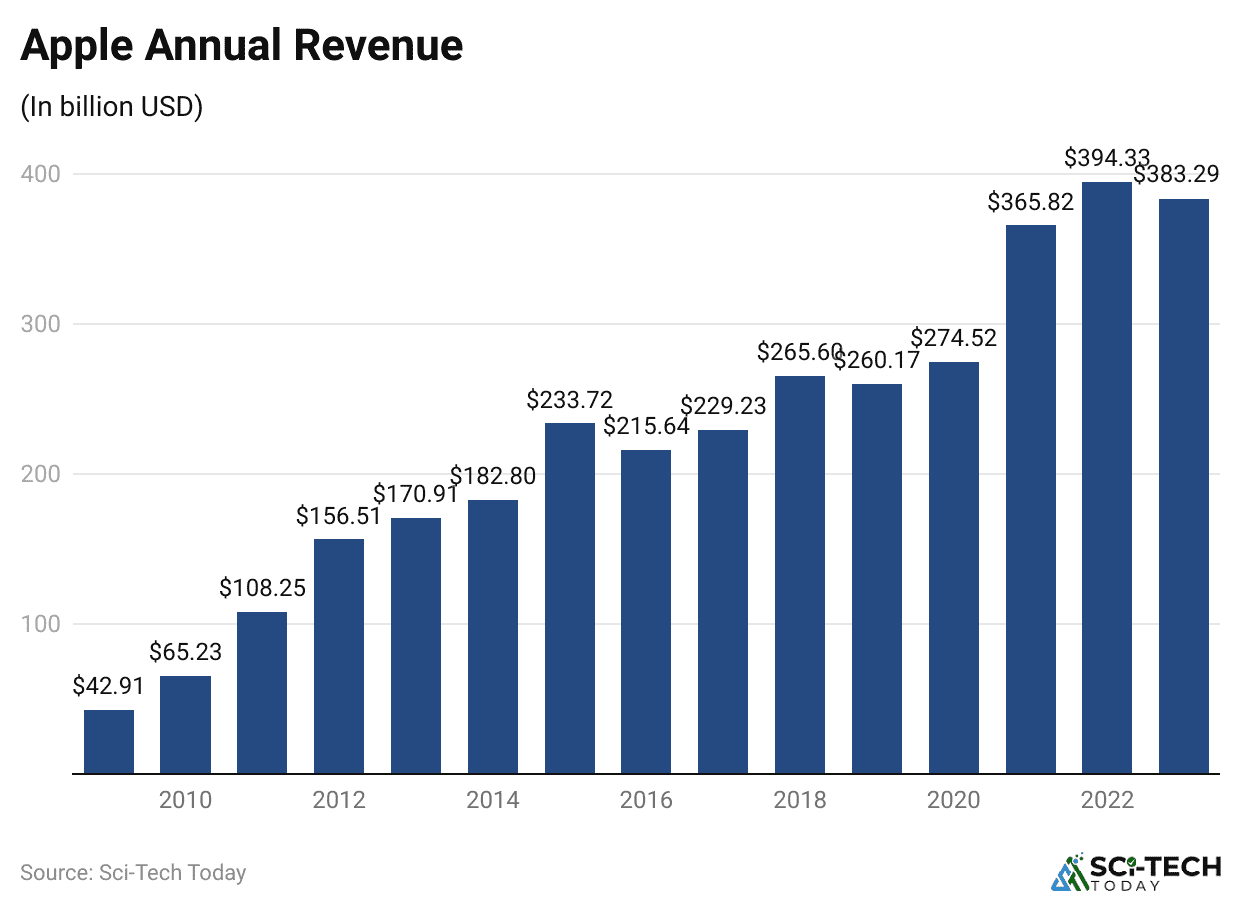
(Reference: backlinko.com)
| Year | Apple Annual Revenue |
2023 | USD 383.29 billion |
| 2022 | USD 394.33 billion |
2021 | USD 365.82 billion |
| 2020 | USD 274.52 billion |
2019 | USD 260.17 billion |
| 2018 | USD 265.6 billion |
2017 | USD 229.23 billion |
| 2016 | USD 215.64 billion |
2015 | USD 233.72 billion |
| 2014 | USD 182.8 billion |
2013 | USD 170.91 billion |
| 2012 | USD 156.51 billion |
2011 | USD 108.25 billion |
| 2010 | USD 65.23 billion |
2009 | USD 42.91 billion |
- Apple’s quarterly revenue was USD 90.75 billion in Q2 2024, representing an almost 4.31% year-over-year decrease.
Apple’s First Quarter Revenue (2025)
- Apple’s quarterly revenue for the fiscal first quarter of 2025 reached USD 124.3 billion, reflecting a 4% year-over-year increase.
- Quarterly diluted earnings per share (EPS) was USD 2.40, marking a 10% year-over-year increase.
- Over USD 30 billion was returned to shareholders through buybacks and dividends.
- Apple’s installed base of active devices reached an all-time high across all products and geographic regions.
- Apple Intelligence, powered by Apple silicon, will expand to more languages in April 2025.
- A cash dividend of USD 0.25 per share was declared on Apple’s common stock.
- The dividend will be payable on February 13, 2025, to shareholders of record as of February 10, 2025.
- Strong operating margins contributed to record-high EPS growth.

(Reference: backlinko.com)
| Date | Apple’s Quarterly Revenue |
| Q2 2024 | USD 90.75 billion |
Q1 2024 | USD 119.58 billion |
| Q4 2023 | USD 89.5 billion |
Q3 2023 | USD 81.8 billion |
| Q2 2023 | USD 94.84 billion |
Q1 2023 | USD 117.15 billion |
| Q4 2022 | USD 90.15 billion |
Q3 2022 | USD 82.96 billion |
| Q2 2022 | USD 97.28 billion |
Q1 2022 | USD 123.95 billion |
| Q4 2021 | USD 83.36 billion |
Q3 2021 | USD 81.43 billion |
| Q2 2021 | USD 89.58 billion |
Q1 2021 | USD 111.44 billion |
| Q4 2020 | USD 64.7 billion |
Q3 2020 | USD 59.69 billion |
| Q2 2020 | USD 58.31 billion |
Q1 2020 | USD 91.82 billion |
| Q4 2019 | USD 64.04 billion |
Q3 2019 | USD 53.81 billion |
| Q2 2019 | USD 58.02 billion |
Q1 2019 | USD 84.31 billion |
- Apple’s second-biggest revenue source is its services sector, which includes income from the App Store, iTunes Store, AppleCare, Apple Pay, and other services.
- In the second quarter of 2024, Apple made USD 23.87 billion from services, as per Apple Statistics.
- This is 26.3% of the company’s total revenue for that quarter and is the highest revenue Apple has ever earned from its services.

(Reference: backlinko.com)
| Date | Service Revenue | Share of Total Apple Revenue |
Q2 2024 | USD 23.87 billion | 26.3% |
| Q1 2024 | USD 23.12 billion | 19.33% |
Q4 2023 | USD 22.31 billion | 24.93% |
| Q3 2023 | USD 21.21 billion | 25.93% |
Q2 2023 | USD 20.91 billion | 22.05% |
| Q1 2023 | USD 20.77 billion | 17.73% |
Q4 2022 | USD 19.19 billion | 21.28% |
| Q3 2022 | USD 19.6 billion | 23.63% |
Q2 2022 | USD 19.82 billion | 20.37% |
| Q1 2022 | USD 19.52 billion | 15.76% |
Q4 2021 | USD 18.28 billion | 21.93% |
| Q3 2021 | USD 17.49 billion | 21.47% |
Q2 2021 | USD 16.9 billion | 18.87% |
| Q1 2021 | USD 15.76 billion | 14.14% |
Q4 2020 | USD 14.55 billion | 22.5% |
| Q3 2020 | USD 13.16 billion | 22.04% |
Q2 2020 | USD 13.35 billion | 22.89% |
| Q1 2020 | USD 12.72 billion | 13.85% |
Q4 2019 | USD 12.51 billion | 19.54% |
| Q3 2019 | USD 11.46 billion | 21.29% |
Q2 2019 | USD 11.45 billion | 19.74% |
| Q1 2019 | USD 10.88 billion | 12.9% |
Q4 2018 | USD 9.98 billion | 15.87% |
| Q3 2018 | USD 10.17 billion | 17.93% |
Q2 2018 | USD 9.85 billion | 15.03% |
| Q1 2018 | USD 8.47 billion | 9.59% |
- Apple’s earnings from wearables, home products, and accessories come from sales of the Apple Watch, wireless headphones, HomePod, Apple TV, and other accessories, as stated by Apple Statistics.
- In the second quarter of 2024, Apple made USD 7.91 billion from these products. This represents 8.72% of the company’s total revenue for the quarter, which is more than what they earned from Mac sales (USD 7.45 billion) or iPad sales (USD 5.56 billion).

(Reference: backlinko.com)
| Date | Wearables, Home, and Accessories Revenue | Share of total Apple Revenue |
Q2 2024 | USD 7.91 billion | 8.72% |
| Q1 2024 | USD 11.95 billion | 10% |
Q4 2023 | USD 9.32 billion | 10.42% |
| Q3 2023 | USD 8.28 billion | 10.13% |
Q2 2023 | USD 8.76 billion | 9.23% |
| Q1 2023 | USD 13.48 billion | 11.51% |
Q4 2022 | USD 9.65 billion | 10.7% |
| Q3 2022 | USD 8.08 billion | 9.74% |
Q2 2022 | USD 8.81 billion | 9.05% |
| Q1 2022 | USD 14.7 billion | 11.86% |
Q4 2021 | USD 8.79 billion | 10.54% |
| Q3 2021 | USD 8.78 billion | 10.78% |
Q2 2021 | USD 7.84 billion | 8.75% |
| Q1 2021 | USD 12.97 billion | 11.64% |
Q4 2020 | USD 7.88 billion | 12.2% |
| Q3 2020 | USD 6.45 billion | 10.81% |
Q2 2020 | USD 6.28 billion | 10.78% |
| Q1 2020 | USD 10.01 billion | 10.9% |
Q4 2019 | USD 6.52 billion | 10.18% |
| Q3 2019 | USD 5.53 billion | 10.27% |
Q2 2019 | USD 5.13 billion | 8.84% |
| Q1 2019 | USD 7.31 billion | 8.67% |
Q4 2018 | USD 4.23 billion | 6.7% |
| Q3 2018 | USD 3.73 billion | 7.02% |
Q2 2018 | USD 3.94 billion | 6.47% |
| Q1 2018 | USD 5.49 billion | 6.22% |
- In the second quarter of 2024, Apple’s Mac sales hit USD 7.45 billion, which was 8.21% of the company’s total revenue for that quarter.
- According to Apple Statistics, in the second quarter of 2024, Apple earned USD 5.56 billion from iPad sales, which made up 6.13% of the company’s total revenue for that quarter.
Here’s a Breakdown of Apple’s Revenue By Region:
- The Americas: This region brought in USD 37.27 billion, which is 41.07% of Apple’s total revenue. Revenue from the Americas dropped by 1.35% over the past year.
- Europe: Europe is Apple’s second-biggest market, with USD 24.12 billion in revenue, accounting for 26.58% of the total.
- Greater China: The Greater China market generated USD 16.37 billion, representing 18.04% of Apple’s revenue for the quarter.
- Japan: Apple’s revenue in Japan was USD 6.26 billion, or 6.9% of the total revenue.
- Rest of Asia Pacific: This region contributed USD 6.72 billion, which is 7.41% of Apple’s total revenue for the quarter.
Apple Stock Market Statistics
Valuation Measures
| Current | 3/31/2024 | 12/31/2023 | 9/30/2023 | 6/30/2023 | 3/31/2023 | |
Enterprise Value/EBITDA | 25.89 | 20.10 | 23.66 | 21.46 | 24.51 | 20.84 |
| Enterprise Value/Revenue | 9.02 | 6.96 | 7.98 | 7.09 | 8.06 | 6.89 |
Price/Book | 45.90 | 35.49 | 47.90 | 44.17 | 49.08 | 45.99 |
| Price/Sales | 9.09 | 6.99 | 7.94 | 7.10 | 8.08 | 6.89 |
PEG Ratio (5yr expected) | 2.33 | 2.11 | 2.31 | 2.18 | 2.66 | 2.79 |
| Forward P/E | 29.94 | 26.32 | 29.15 | 25.77 | 29.41 | 27.86 |
Trailing P/E | 34.54 | 26.67 | 31.41 | 28.73 | 32.88 | 28.00 |
| Enterprise Value | 3.44T | 2.68T | 3.06T | 2.72T | 3.10T | 2.67T |
Market Cap | 3.41T | 2.65T | 2.99T | 2.68T | 3.05T | 2.61T |
Stock Price History
| 200-Day Moving Average 3 | 189.12 |
| 50-Day Moving Average 3 | 211.50 |
52 Week Low 3 | 164.08 |
| 52 Week High 3 | 237.23 |
S&P 500 52-Week Change 3 | 22.67% |
| 52 Week Range 3 | 16.17% |
Beta (5Y Monthly) | 1.24 |
Share Statistics
| Shares Short (prior month 6/14/2024) 4 | 153.41M |
| Short % of Shares Outstanding (7/15/2024) 4 | 0.88% |
Short % of Float (7/15/2024) 4 | 0.88% |
| Short Ratio (7/15/2024) 4 | 1.83 |
Shares Short (7/15/2024) 4 | 135.38M |
| % Held by Institutions 1 | 57.60% |
% Held by Insiders 1 | 5.22% |
| Float 8 | 15.31B |
Implied Shares Outstanding 6 | 14.41B |
| Shares Outstanding 5 | 15.33B |
Avg Vol (10 days) 3 | 48.6M |
| Avg Vol (3 months) 3 | 67.15M |
Dividends & Splits
| Last Split Date 3 | 8/31/2020 |
| Last Split Factor 2 | 4:1 |
Ex-Dividend Date 4 | 5/10/2024 |
| Dividend Date 3 | 5/16/2024 |
Payout Ratio 4 | 14.93% |
| 5-Year Average Dividend Yield 4 | 0.69 |
Trailing Annual Dividend Yield 3 | 0.44% |
| Trailing Annual Dividend Rate 3 | 0.96 |
Forward Annual Dividend Yield 4 | 0.46% |
| Forward Annual Dividend Rate 4 | 1 |
Apple Statistics By Traffic Sources
(Reference: coolest-gadgets.com)
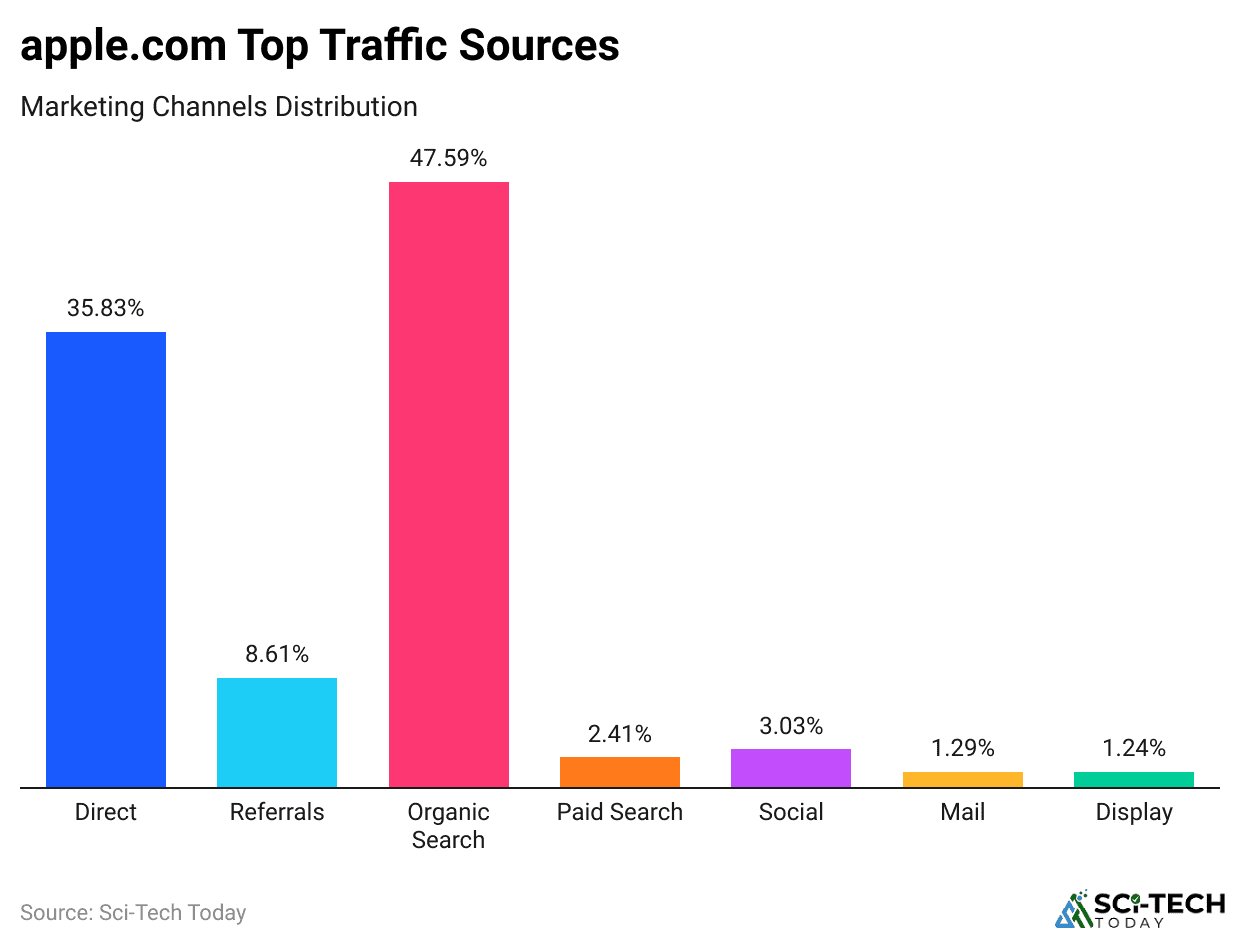
- According to Apple Statistics, 47.59% of traffic to apple.com comes from organic searches.
- Direct traffic is next, representing 35.83%, followed by 8.61% from referral links.
Other sources of traffic include:
- Social media: 3.0%
- Paid search ads: 2.41%
- Email: 1.29%
- Display ads: 1.24%
Apple Sales Statistics
- iPhone sales are stated for almost 50.46% of Apple’s quarterly revenue in Q2 2024, which amounted to USD 45.96 billion.

(Reference: backlinko.com)
- The iPhone section remains the biggest section in terms of sales to Apple to date. Following is the detailed breakdown of iPhone sales from Q1 2018 that also includes the revenue of Apple:
| Date | iPhone Sales | Share of Total Apple Revenue |
| Q2 2024 | USD 45.96 billion | 50.64% |
Q1 2024 | USD 69.7 billion | 58.29% |
| Q4 2023 | USD 43.81 billion | 48.95% |
Q3 2023 | USD 39.67 billion | 48.5% |
| Q2 2023 | USD 51.33 billion | 54.13% |
Q1 2023 | USD 65.78 billion | 56.14% |
| Q4 2022 | USD 42.63 billion | 47.29% |
Q3 2022 | USD 40.67 billion | 49.02% |
| Q2 2022 | USD 50.57 billion | 51.99% |
Q1 2022 | USD 71.63 billion | 57.8% |
| Q4 2021 | USD 38.87 billion | 46.63% |
Q3 2021 | USD 39.57 billion | 48.59% |
| Q2 2021 | USD 47.94 billion | 53.51% |
Q1 2021 | USD 65.6 billion | 58.86% |
| Q4 2020 | USD 26.44 billion | 40.9% |
Q3 2020 | USD 26.42 billion | 44.26% |
| Q2 2020 | USD 28.96 billion | 49.7% |
Q1 2020 | USD 55.96 billion | 60.9% |
| Q4 2019 | USD 33.36 billion | 52.1% |
Q3 2019 | USD 25.99 billion | 48.29% |
| Q2 2019 | USD 31.05 billion | 53.52% |
Q1 2019 | USD 51.98 billion | 61.66% |
| Q4 2018 | USD 37.19 billion | 59.12% |
Q3 2018 | USD 29.47 billion | 56.15% |
| Q2 2018 | USD 37.56 billion | 62.21% |
Q1 2018 | USD 61.58 billion | 69.74% |
- The following chart shows the Apple Mac and Macbook sales from 2017 to 2024.

(Reference: wallstreetzen.com)
- Apple sold almost 21.7 million Macs and Macbooks in 2022, which was down from 29 million in 2022.
- Around 24% of the households in the United States have a Macbook.

(Reference: wallstreetzen.com)
- Apple sold almost 38.3 million Apple Watches in 2023, which came down from 53.9 million in 2022.
Apple Statistics By Social Media Traffic

(Reference: coolest-gadgets.com)
- YouTube brings the most traffic to apple.com from social media, making up 28.21%.
- Facebook provides 8.61% of the traffic, and LinkedIn contributes 7.34%.
- Other social media networks together account for 17.53% of the traffic.
- Twitter and Reddit contribute 22.32% and 15.99% of the traffic, respectively.
Apple TV Statistics

(Reference: coolest-gadgets.com)
- According to Apple Statistics, almost 42.1 million people globally use Apple TV or 12.4% of the population.
- Apple TV users are going to grow in the future, reaching 44.1 million in 2024, 45.9 million in 2025, and 47.7 million in 2026.
- Apple TV users’ statistics by population share was 12.9% in 2024, 13.3% in 2025, and 13.8% in 2026, as per Apple Statistics.
Apple Statistics By Web Traffic
- As of January 20, 2024, the United States was the top country for visits to Apple.com, accounting for 33.18% of the total traffic. It also saw the highest increase, with a 1.4% growth in the number of visitors.
Other countries and their traffic contributions were:
- Japan: 5.57% (+4.8%)
- The United Kingdom: 4.9% (+3.61%)
- Canada: 4.02% (+1.04%)
- China: 3.89% (-4.61%)
- Together, the rest of the countries made up 48.44% of the total web traffic.
Apple Services Statistics
- In the first quarter of 2022, Apple earned USD 20.77 billion from iTunes, software, and services.
- In comparison, Apple made USD 19.56 billion from its services and software in the same quarter.
- According to Apple Statistics, Apple’s revenue from services had slightly decreased to USD 19.19 billion by the last quarter of 2022.
- In 2022, Apple Services earned USD 78 billion in revenue.
To compare:
- In 2021, Apple Services made USD 68.4 billion.
- In 2020, it generated USD 53.6 billion.
- For iPhone apps on the Apple App Store, Tinder was the top earner globally, making USD 37.58 million in 2022. The second highest-earning app was TikTok, which brought in USD 35.14 million.
| Applications | Revenue Generated |
| Tencent Video | 15.43 million |
| Monster Strike | 16.34 million |
Genshin Impact | 17.03 million |
| Game for Peace | 17.87 million |
Disney+ | 19.01 million |
| Puzzle & Dragons | 20.84 million |
Candy Crush Saga | 21.1 million |
| Honor of Kings | 24.05 million |
TikTok | 35.14 million |
| Tinder | 37.58 million |
- The famous section of apps on the Apple App Store is gaming applications, which make up 12.68% of all the applications available.
- The second most common category is business apps, which represent 10.35% of the total apps on the store.
| Application Category | Share of Apps |
Finance | 4.16% |
| Productivity | 4.84% |
Health & Fitness | 5.08% |
| Shopping | 5.26% |
Food & Drink | 6.58% |
| Lifestyle | 7.93% |
Utilities | 9.22% |
| Education | 9.79% |
Business | 10.35% |
| Games | 12.68% |
- Apple earned USD 29.92 billion from marketable securities maturing and USD 107.4 billion from selling these securities.
- In 2021, Apple made USD 59.02 billion from securities maturing and USD 47.46 billion from their sale.
- According to Loup Ventures, more than half of Apple users use Apple Pay. The number of active Apple Pay users grew from 337 million in 2017 to 631 million.
- Apple Music is the second most popular music streaming service worldwide, with over 88 million users.
- It ranks just behind Spotify and is liked by many Apple users for its high-quality sound and features.
- Apple News has 125 million active users. While not the most popular service, its user count has grown from 115 million in 2021 to 125 million in 2022, according to Apple Statistics.
- Apple invested USD 6 billion in Apple TV+, but it struggled to compete with established services like Netflix, Amazon, and Disney. To boost its user base, Apple offers a one-year free subscription to new iPhone and iPad owners.
- Over 660 million Apple users use Siri. This is an increase from 585 million users in 2019, with a growth of 75 million the following year.
- Apple last updated Siri’s user numbers in 2020, but the company has improved Siri’s accuracy from 66% to 87%.
Apple Watch Statistics
(Reference: coolest-gadgets.com)
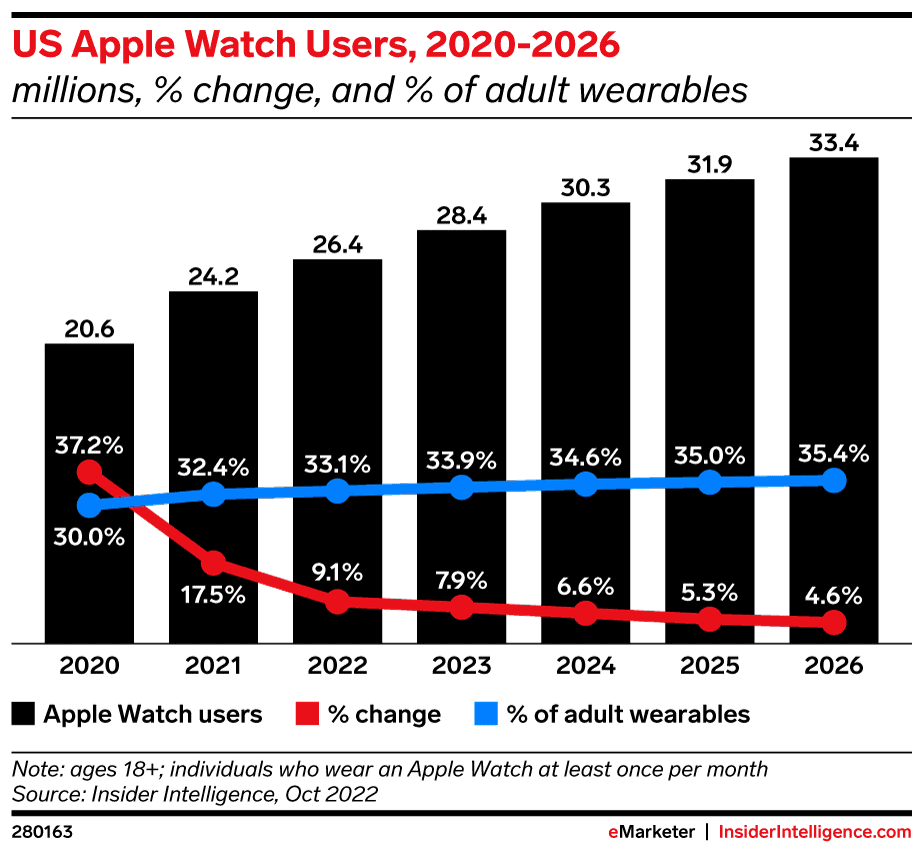
- According to the data, there are currently 28.4 million Apple Watch users in the United States, with a growth rate of 7.9%.
- According to Apple Statistics, this number is expected to rise to 30.3 million
- by the end of 2024.
- The number of users is projected to continue increasing in the following years, reaching 31.9 million in 2025 and 33.4 million in 2026.
Apple Statistics By Device Traffic
| Country | All devices | Desktop | Mobile | |
| United States | 36.78% | 315.21M | 43.11% | 56.89% |
| India | 4.99% | 42.81M | 28.34% | 71.66% |
| Japan | 4.29% | 36.77M | 42.94% | 57.06% |
| United Kingdom | 4.03% | 34.75M | 50.03% | 49.97% |
| Brazil | 3.43% | 29.39M | 31.76% | 68.24% |
- In January 2024, apple.com saw 39.94% of its traffic from desktop computers and 60.06% from mobile devices.
- The United States had the highest traffic, making up 36.78% of the total, with 315.21 million visits. Among these, 43.11% used desktops, and 56.89% used mobile devices.
Traffic from other countries included:
- India: 4.99% (42.81 million visits), with 28.34% using desktops and 71.66% using mobiles.
- Japan: 4.29% (36.77 million visits), with 42.94% using desktops and 57.06% using mobiles.
- The United Kingdom: 4.03% (34.57 million visits), with 50.03% using desktops and 49.97% using mobiles.
- Brazil: 3.43% (29.39 million visits), with 31.76% using desktops and 68.24% using mobiles.
iPhone 15 Statistics
- The iPhone 15 launched globally with great excitement, leading to long lines at Apple stores in the US, China, India, and Europe.
- Apple saw its highest sales in the third quarter of 2023 thanks to the release of the iPhone 15.
- iPhone 15’s Surge in China – In the first few hours after the iPhone 15 launch, sales jumped by 253% compared to the previous year, according to JD.com, a major online retailer in China, as per Apple Statistics.
- iPhone 15’s Global Pre-Order Success—Pre-orders for the iPhone 15 have been 10% to 12% higher than pre-orders for the iPhone 14.
- iPhone 15 Pro Max Expected to Lead Sales – The iPhone 15 Pro Max is predicted to be the most popular model in the iPhone 15 series, making up 35% to 40% of all shipments in 2023. Shipments of the iPhone 15 Pro Max are expected to increase by about 10% compared to the iPhone 14 Pro Max.
- Since the iPhone 14 Pro Max was the top-selling smartphone globally in the first half of the year, it suggests that people like larger screens!
- As of January 2024, the iPhone 15 Pro Max has the highest global adoption rate at 3.64%.
Month & Year | iPhone 15 | iPhone 15 Plus | iPhone 15 Pro | iPhone 15 Pro Max |
September 2023 | 0.12% | 0.05% | 0.31% | 0.27% |
| October 2023 | 0.58% | 0.23% | 1.21% | 1.25% |
November 2023 | 0.85% | 0.35% | 1.69% | 2.11% |
| December 2023 | 1.29% | 0.51% | 2.37% | 3.06% |
January 2024 | 1.66% | 0.66% | 2.3% | 3.64% |
Apple Statistics By Demographics

(Reference: coolest-gadgets.com)
- According to Apple’s data, the largest group of users on Apple.com is aged 25 to 34 years, representing 32.17% of the total.
- Around 20.78% of users are between 35 and 44 years old, according to Apple Statistics.
- 55% of the site’s visitors are users aged 18 to 24, while those aged 45 to 54 account for 14.39%.
- Additionally, 84% of users are between 55 and 64 years old, and 5.27% are 65 years or older.
- For gender, 58.02% of users are male, and 41.98% are female.
Apple Store and App Store Category Statistics
(Reference: coolest-gadgets.com)
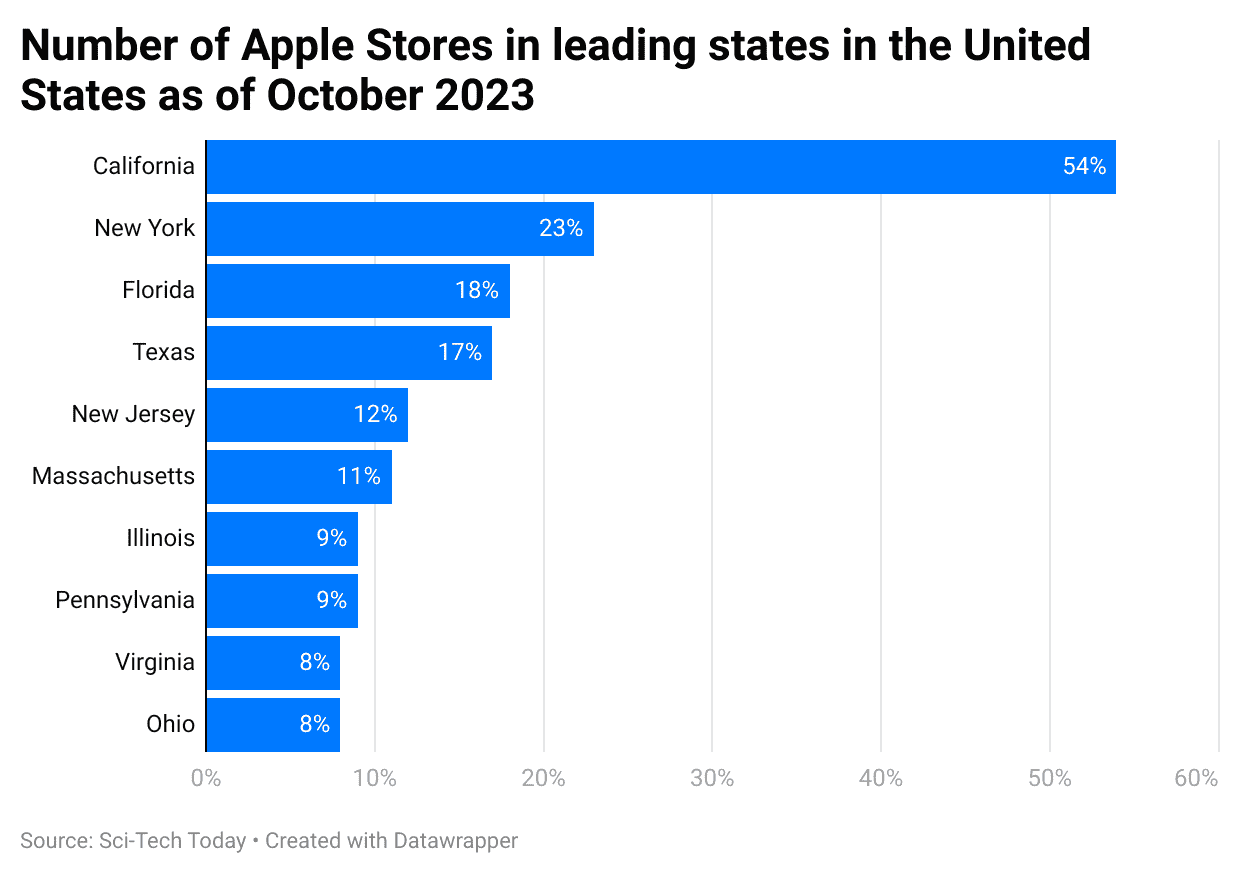
- As of October 2023, there are more than 270 Apple stores in major states across the US.
- Apple Statistics surveyed that California has the most Apple stores, with about 54 locations.
Other states and their number of stores are:
- New York: 23
- Florida: 18
- Texas: 17
- New Jersey: 12
- Massachusetts: 11
- Illinois: 9
- Pennsylvania: 8
- Ohio: 8

(Reference: coolest-gadgets.com)
In the 3rd quarter of 2023, the top app store categories in the US were:
- Games: 339,568
- Business: 224,740
- Education: 193,687
- Lifestyle: 191,230
- Utilities: 143,422
- Health and Fitness: 80,424
- Productivity: 72,158
The less popular categories included:
- Navigation: 23,457
- Stickers: 25,467
- News: 39,765
- Reference: 41,999
Employee Benefits at Apple
Apple is famous for both its innovative products and its great employee benefits. Here are the top 10 perks that stand out:
- Company-Wide Music Events – Apple organizes special music events just for employees, where they can enjoy music and build a sense of community.
- Fertility Support – Apple offers fertility assistance, including services like egg freezing, to help employees with the costs of starting a family.
- Health Insurance Choices – Employees can choose between UHC or Aetna health insurance plans, with or without a Health Savings Account (HSA), ensuring they get the coverage they need.
- Gym Access and Discounts—The on-site gym is open to employees for just USD 9 per pay period, encouraging a healthy lifestyle.
- Parental Leave – Apple provides up to 6 weeks of paternity leave and 16 weeks of maternity leave, supporting new parents during their time off.
- HSA Contributions – Apple contributes USD 750 each year to employees’ Health Savings Accounts to help cover medical costs.
- Paid Time Off – Employees get 12 days of paid vacation or personal time and 12 days of sick leave each year to rest and recover.
- Wellness Reimbursement – Apple reimburses up to USD 360 per year for gym or wellness expenses, which is USD 30 each month.
- Employee Assistance Program—This program includes benefits like accidental death and dismemberment insurance, free snacks worth USD 730 annually, and access to gender-neutral restrooms.
- Financial and Retirement Benefits – Apple offers a Stock Purchase Program with up to a 15% discount, a 401(k) plan with a generous company match, and various accounts and plans to help with long-term financial health.
Cost of iPhone For Each Household
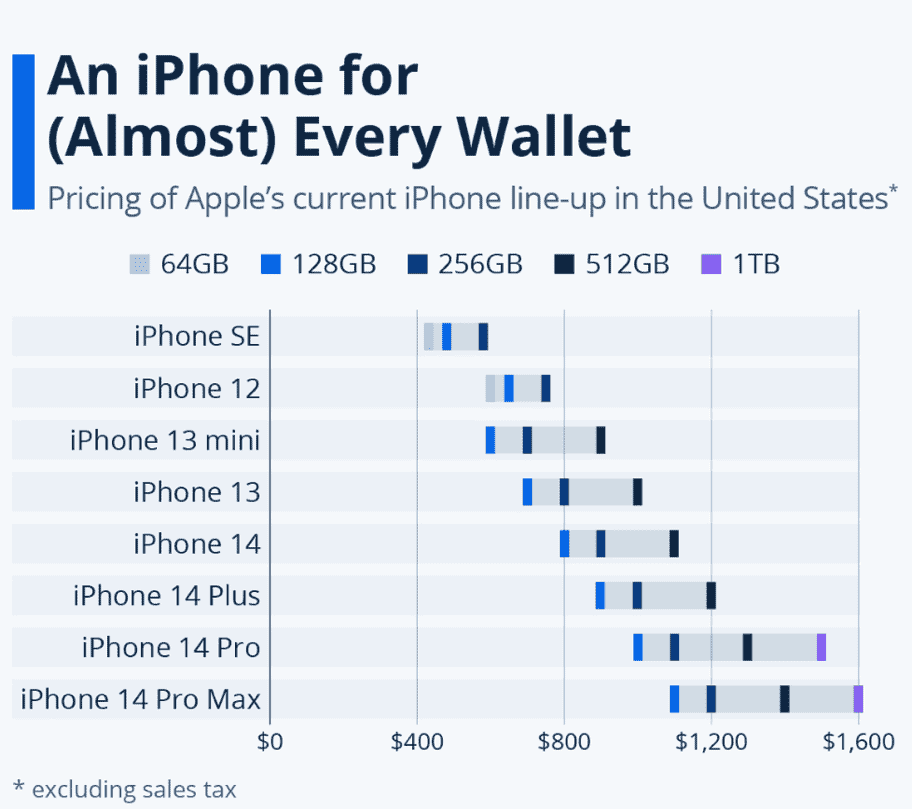
(Source: enterpriseappstoday.com)
- In the above chart, we can see the iPhone for each wallet: 64 GB, 128GB, 256GB, 512GB, and 1TB.
- As of 2024, the iPhone holds a 28.46% market share in the global smartphone market.
- As of March 2024, the iPhone’s market share in India is 4.02%.
- In China, the iPhone has a 24.43% market share.
- In the US, the iPhone has a 59.08% market share.

(Reference: demandsage.com)
- Between June 2021 and March 2024, the iPhone averaged a 55.94% market share in the United States.
- According to Apple Statistics, the iPhone had a 24.39% market share in China as of March 2024.
- In the following table, we can see the iPhone Market Share in China between March 2023 and March 2024:
| Time of Year | Market Share |
March 2023 | 23.61% |
| April 2023 | 34.66% |
| May 2023 | 22.8% |
| June 2023 | 20.48% |
| July 2023 | 21.6% |
| August 2023 | 22.81% |
| September 2023 | 24.98% |
| October 2023 | 23.36% |
| November 2023 | 21.8% |
| December 2023 | 22.37% |
| January 2024 | 25.04% |
| February 2024 | 24.48% |
| March 2024 | 24.39% |
Conclusion
Apple now holds over 50% of the global market. Even with store closures during the lockdown, the company still achieved impressive revenue within two years after COVID-19.Apple is renowned for its emphasis on security and the distinctiveness of its products. Today, you can have a smart home where all Apple devices are connected and controlled by voice commands.
Therefore, in 2025, buying Apple products is still a great choice! We have shed enough light on Apple Statistics through this article.
Sources
FAQ.
The iPhone is Apple’s top product, and its success has helped Apple create a unique ecosystem of hardware, software, and services. This contributed to Apple’s revenue of over $383 billion in 2023, making it the most valuable brand in the world.
China grows the most apples in the world, followed by the United States, Poland, Italy, and France. Apples are well known for their health benefits and are grown in nearly every country.
Apple (AAPL) stock is owned by a variety of investors. Institutional investors hold about 36.25% of the stock, insiders own 0.11%, and the public and individual investors own the remaining 63.64%.
Apple’s target customers are middle-class and upper-class people who can afford to pay more for products that provide a great user experience. These customers usually have more disposable income and are willing to spend extra on Apple’s higher-priced items.
On the NYSE and Nasdaq stock exchanges, Apple’s largest customers are cell phone carriers such as AT&T and Verizon. The iPhone is Apple’s top-selling product. Apple sells these phones to retailers like Best Buy, who then sell them to individual customers.

Joseph D'Souza founded Sci-Tech Today as a personal passion project to share statistics, expert analysis, product reviews, and experiences with tech gadgets. Over time, it evolved into a full-scale tech blog specializing in core science and technology. Founded in 2004 by Joseph D’Souza, Sci-Tech Today has become a leading voice in the realms of science and technology. This platform is dedicated to delivering in-depth, well-researched statistics, facts, charts, and graphs that industry experts rigorously verify. The aim is to illuminate the complexities of technological innovations and scientific discoveries through clear and comprehensive information.


